Professional Use of the ADX Indicator in Trading: Strategies and Tips
As a trader, it is crucial to have access to tools that can help you make informed decisions when buying and selling securities. One such tool is the ADX indicator.
In this comprehensive guide, we will explore the ADX, how to use it, and the most important trading strategies that this indicator offers. We will also learn about ADX analysis, its settings, and how to generate signals using the ADX indicator. Therefore, we recommend reading this article to the end to understand this practical tool fully.
What is the ADX Indicator, and How is it Calculated?
The ADX indicator, or Average Directional Index, is an important analytical tool for identifying the direction of market trends. This indicator has three main components: the +DI curve, the -DI curve, and the main ADX line.
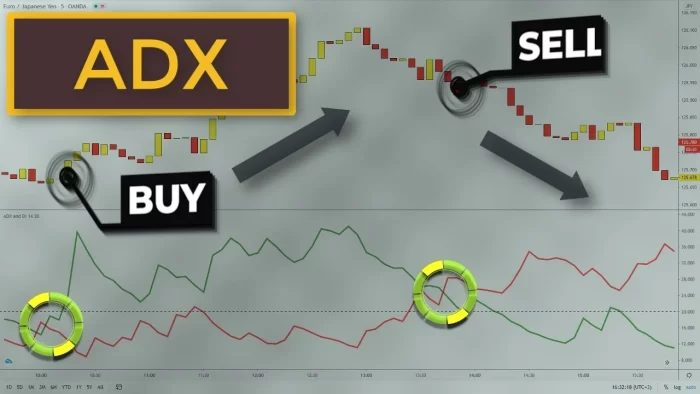
The ADX indicator measures the strength of a trend, not its direction.
The +DI curve represents the strength of upward trends. When this line is above the -DI line and is rising, it indicates a strengthening upward trend. In other words, as the +DI line increases, the likelihood of a stronger upward trend grows.
On the other hand, the -DI curve represents the strength of downward trends. When this line is above the +DI line and is rising, it indicates a stronger downward trend. Similarly, an upward movement in the -DI line suggests an increasing likelihood of a stronger downward trend.
The ADX line, which is derived from the combination of the +DI and -DI curves, indicates the overall strength of the market trend. When the ADX line rises above a certain level (such as 25), it signals the presence of a defined trend in the market. The higher the ADX line goes, the stronger the market trend becomes. For instance, an increase in the ADX line and its rise above 25 suggests a higher likelihood of a strong market trend.
Additionally, when the ADX line is flat and without a slope, it indicates a stable, non-trending market condition. In such cases, the market typically lacks a clear trend or direction, and traders are advised to avoid entering the market until a more defined trend emerges.
History
The ADX indicator, or Average Directional Index, is one of the key tools in a trading system known as the Directional Movement System.
Welles Wilder, the creator of this system, designed it to analyze assets and daily price charts. However, these tools can also be applied to stock analysis. This system operates based on identifying positive and negative directional movements, which Wilder detected by comparing changes in price highs and lows.
Welles Wilder’s book New Concepts in Technical Trading Systems, published in 1978, introduced these directional movement indicators.
This book also includes other analytical tools such as the ATR (Average True Range), Parabolic SAR, and RSI (Relative Strength Index). These indicators, introduced before the digital age, are still widely used today due to their high reliability in trading.
Formula and Calculation of the ADX Indicator
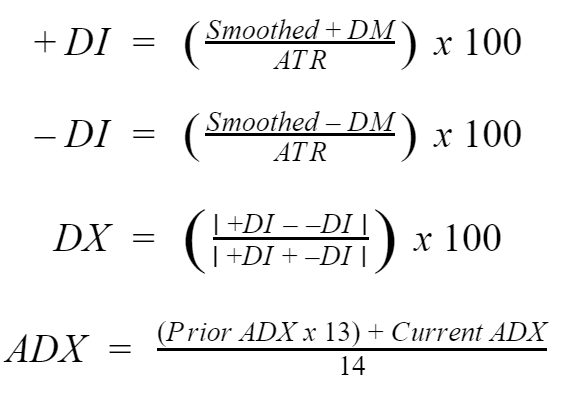
As you can see in the formula, calculating the ADX indicator curve involves several steps. First, to determine the DI values, you must examine the differences between high and low prices over a specified period.
The first step involves calculating DM+, which is obtained by subtracting the previous high price from the current high price. Similarly, DM- equals subtracting the previous low price from the current low price. Between these two values, the larger number is selected as either DI+ or DI-, and the other is disregarded.
Next, the DX must first be computed to calculate the ADX curve. This is done by dividing the absolute difference between DI+ and DI- by their sum over a specified time period and then multiplying the result by 100.
After obtaining the DX value, to calculate the initial ADX value, calculate the average DX for the desired number of days (for example, 14 days). This is done by dividing the sum of the DX values by the number of days. To calculate the ADX values for subsequent periods, multiply the previous ADX value by the number of desired days minus one (for example, 13), add the new DX value, and divide the result by the number of days.
Important Rules of the ADX Indicator in Forex Strategy
The first trading rule of the ADX indicator states that if the indicator is below 25, it indicates a period of no trading or a weak trend. The second trading rule states that when the ADX is above 25, it is enough to show the presence of a strong upward or downward Trend.
Also, remember that the ADX indicator does not provide any information about the market’s direction. This indicator only gives you information about the strength of a trend.
Advantages and Disadvantages of Using the ADX Indicator in Forex Strategy
Advantages:
Using the ADX indicator along with DI+ and DI- to determine the strength and direction of a trend has significant benefits. ADX helps traders enter and exit trades with greater accuracy. When the ADX value exceeds 25 and continues to rise, many traders consider this an opportunity to enter a trade.
Whenever the ADX value falls below 25, it signals the end of a trend and is used as a suitable time to exit the trade. However, entering and exiting near the 25 level may yield lower profits because these situations indicate a trend that is either just beginning or losing strength. Therefore, some traders prefer to use a higher level, such as 40, for their entry and exit points, as an ADX above 40 indicates a powerful trend with the highest profit potential.
However, even if the Trend continues in the same direction but the ADX decreases to a level between 25 and 40, the weakening of the Trend may lead to price stabilization, potentially reducing a trader’s profit margin. For this reason, paying attention to ADX highs and lows can also give traders a better understanding of market momentum.
Disadvantages:
Although the ADX indicator is widely used as a trend indicator and is particularly popular, traders must be aware of its challenges and limitations. Using ADX alongside DI+ and DI- can be effective in identifying upward and downward trends and helps fill the gap that using ADX alone might create.
Additionally, ADX does not provide explicit guidelines for exiting trades. Various traders have developed their trade timing strategies based on specific levels within the ADX range, but the indicator offers traders less certainty.
Furthermore, one of ADX’s fundamental challenges is that it functions as a lagging indicator, meaning traders rely on past data to understand potential price movements.
This carries the risk that the signals provided by ADX may lead traders to make loss-making trades. As a result, some traders prefer to combine ADX with leading indicators, which can help confirm the recommendations provided by ADX.
ADX Indicator on TradingView in Forex Strategy
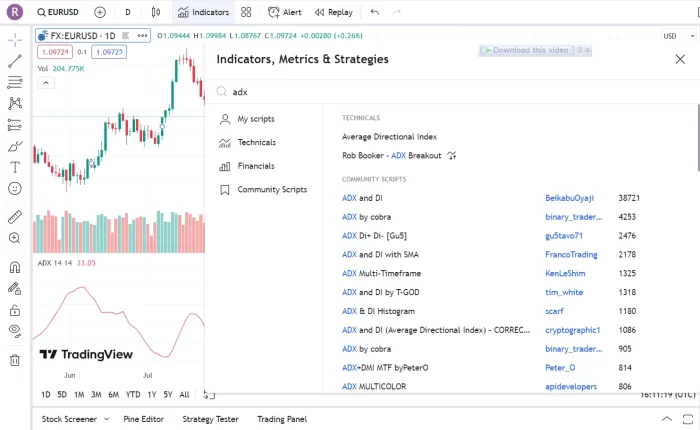
Here are the steps to add the Average Directional Index (ADX) indicator to TradingView:
- Open a chart in TradingView and select the financial instrument you want to analyze.
- Click the “Indicators” button at the top of the chart.
- Search for “Average Directional Index or ADX” in the search bar, and once found, click on it to add it to the bottom of your chart.
- You can adjust settings like point size and color by clicking the gear icon next to the indicator and personalizing it as desired.
- If you wish to add one or more indicators, repeat this process to add other indicators to your chart.
- If the indicator has many lines by default, you can remove them by clicking the settings icon on the chart and unchecking them.
ADX Indicator Analysis in Forex Strategy
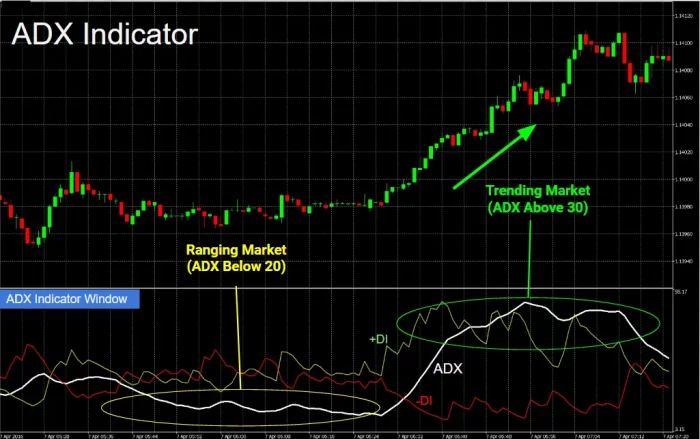
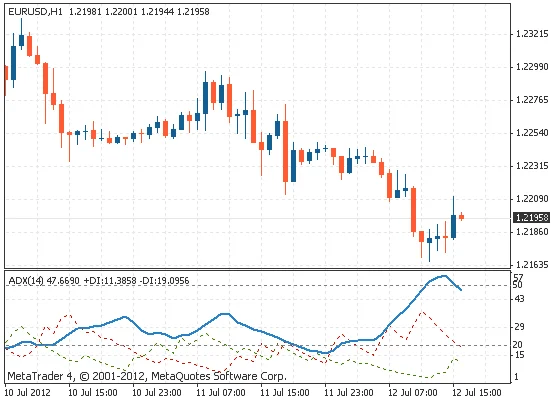
The ADX indicator, the Negative Directional Indicator (-DI), and the Positive Directional Indicator (+DI) are momentum indicators. ADX helps investors determine the strength of a trend, while -DI and +DI assist in identifying the direction of the Trend.
ADX identifies a strong trend when the ADX value is above 25 and indicates a weak trend when the ADX value is below 20. The crossing of DI- and DI+ lines can generate trading signals. For example, this could be a buy signal if the DI+ line crosses above the DI- line and the ADX is above 20, or ideally above 25. On the other hand, if the DI- line crosses above the DI+ line and the ADX is above 20 or 25, this indicates an opportunity to enter a sell trade.
The crossing of the lines can also be used to exit current trades. For example, if you’re in a long (buy) trade, exit when the DI- crosses above the DI+. Meanwhile, when the ADX is below 20, this indicates that the price lacks a trend and may not be an ideal time to enter a trade.
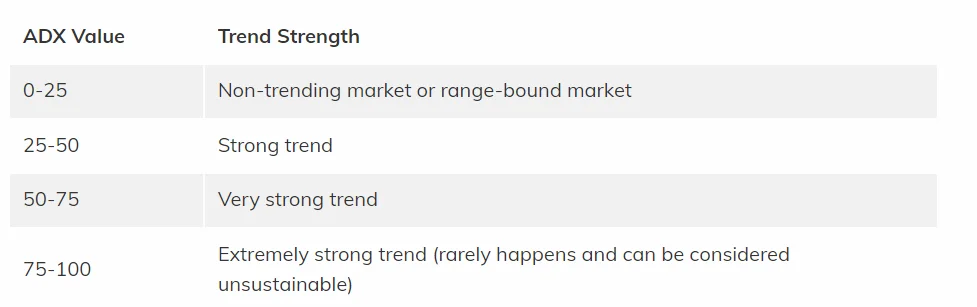
- According to the image above, if the ADX value is between 0 and 25, the market lacks a trend or is range-bound (weak Trend).
- According to the image above, the market has a strong trend if the ADX value is between 25 and 50.
- According to the image above, the market has a powerful trend if the ADX value is between 50 and 75.
- According to the image above, if the ADX value is between 75 and 100, the Trend is powerful (this rarely happens and can be considered very unstable).
How to Generate Signals Using the ADX Indicator in Forex Strategy
The ADX indicator offers several trading signals that can be used to profit in the market if used correctly. Learning to trade these signals can increase your trading accuracy and help you succeed. These signals include:
-
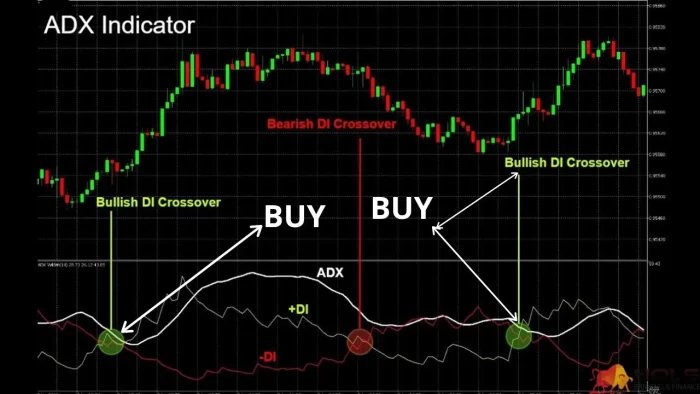
Crossovers
The main goal of using ADX is to focus only on trading qualified opportunities in trending markets. For this reason, it’s essential to pay special attention to the crossovers of the +DI and -DI lines. When DI+ crosses above the DI—line, it indicates that the positive rate of price change in the market is greater than the negative rate of price change.
If this occurs when the ADX is above 25, it is a solid signal to enter a buy (long) position. Similarly, when DI- crosses above DI+, it indicates that the negative rate of price change is greater than the positive price change. If this happens when the ADX is below 25, entering a sell (short) position is a strong signal.
Crossovers are just as important for managing and exiting trades as they are for entering trades. For example, if you are in an extended position and the DI- line crosses above the DI+ line, you can use trailing stop-losses to lock in some of your profits or exit the trade entirely to protect your capital and gains.
-
Finding Ranges
The ADX is a reliable tool for identifying range-bound or trendless market periods. When the ADX indicator drops below 25 and remains there for an extended period, the market lacks a trend or is essentially in a range-bound phase.
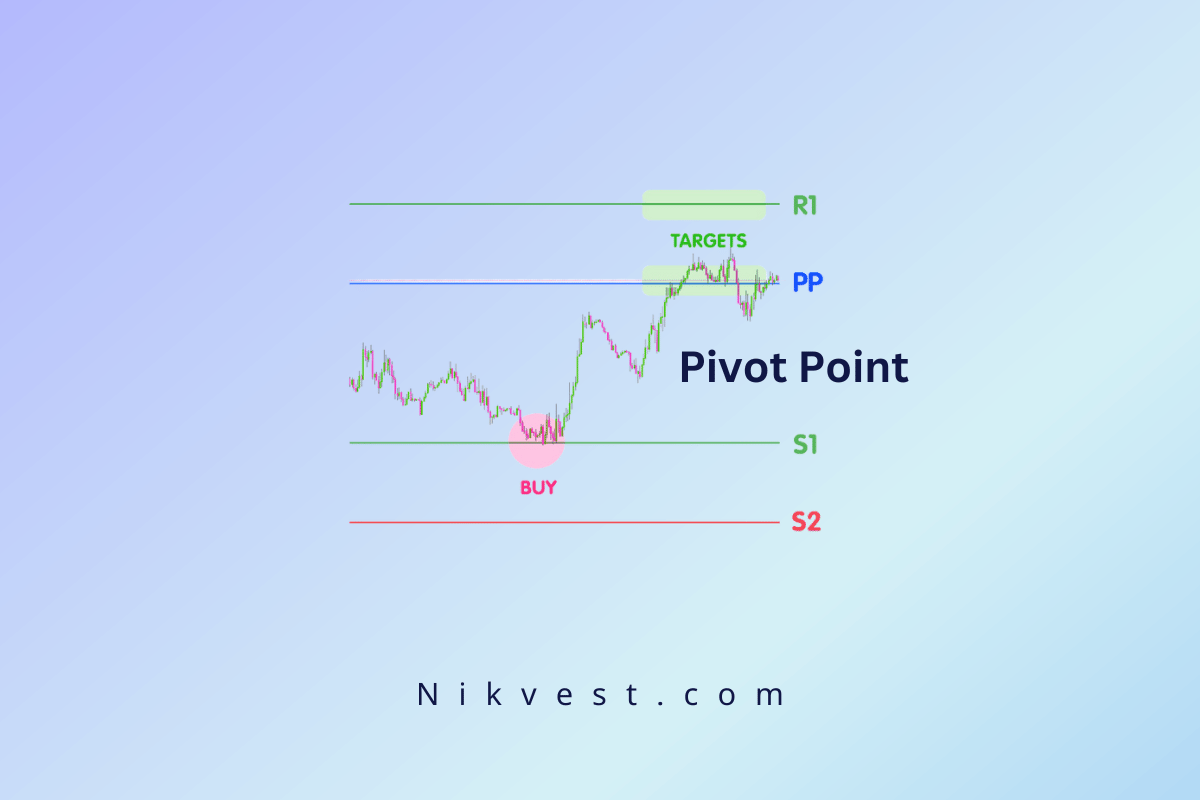
Range-bound or trendless markets are characterized by prices hitting identified support and resistance areas without the ability to break through them. In such markets, buy orders are placed at support levels, and sell orders are placed at resistance levels.
-
Breakouts
A range-bound market will eventually break out. Breakouts occur frequently in markets and can provide a great opportunity for traders. While breakouts are easy to spot, determining whether a breakout is valid or not is much more challenging. There are many false breakouts that can trap traders in a bad trading position.
The ADX indicator helps confirm breakouts. When a price breaks out with an ADX above 25, it indicates that momentum in the new direction could be sustained. However, a breakout with an ADX below 25 is likely invalid or sustainable.
Next, we will learn how to generate signals using the ADX indicator in two popular trading strategies: Day Trading and Swing Trading.
Generating Signals with the ADX Indicator in Day Trading
The ADX day trading strategy begins with selecting the appropriate settings.
Let’s explain why:
Short-term charts move quickly, so you need to adjust the ADX settings to make it more sensitive to short-term price changes in the market. Therefore…
The best ADX setting for day trading is to set the period to 3.
Generally, the shorter the period, the more sensitive the indicator becomes to price changes. So, an ADX period of 3 performs best for day trading.
Low ADX readings indicate a weak trend, while ADX readings above 25 indicate a strong trend. We also know from the natural ebb and flow of the market that prices move from periods of consolidation to trends and vice versa.
Now, if we combine these two market assumptions, we can conclude:
Low ADX readings (consolidation or range) should be followed by higher ADX readings (Trend).
Therefore…
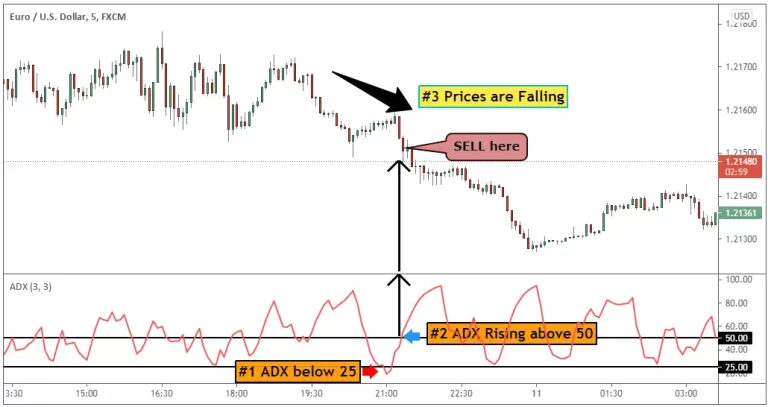
When day trading with the ADX indicator, we look for clues to buy and sell when the ADX drops below 25.
When the ADX drops below 25, the Trend is weak and we are most likely in a consolidation (range-bound) phase. This means that we can look for potential daily breakout signals.
However, since ADX does not show the direction of the Trend, we wait until ADX rises above 50:
- If prices are rising as ADX increases, we buy.
- If prices are falling as ADX increases, we sell.
To better understand this concept, here is an example that demonstrates how the day trading strategy and signal generation using ADX works in practice:
Generating Signals with the ADX Indicator in Swing Trading (Forex Strategy)
Swing trading with the ADX indicator is much simpler because the trend strength indicator works better for position trading.
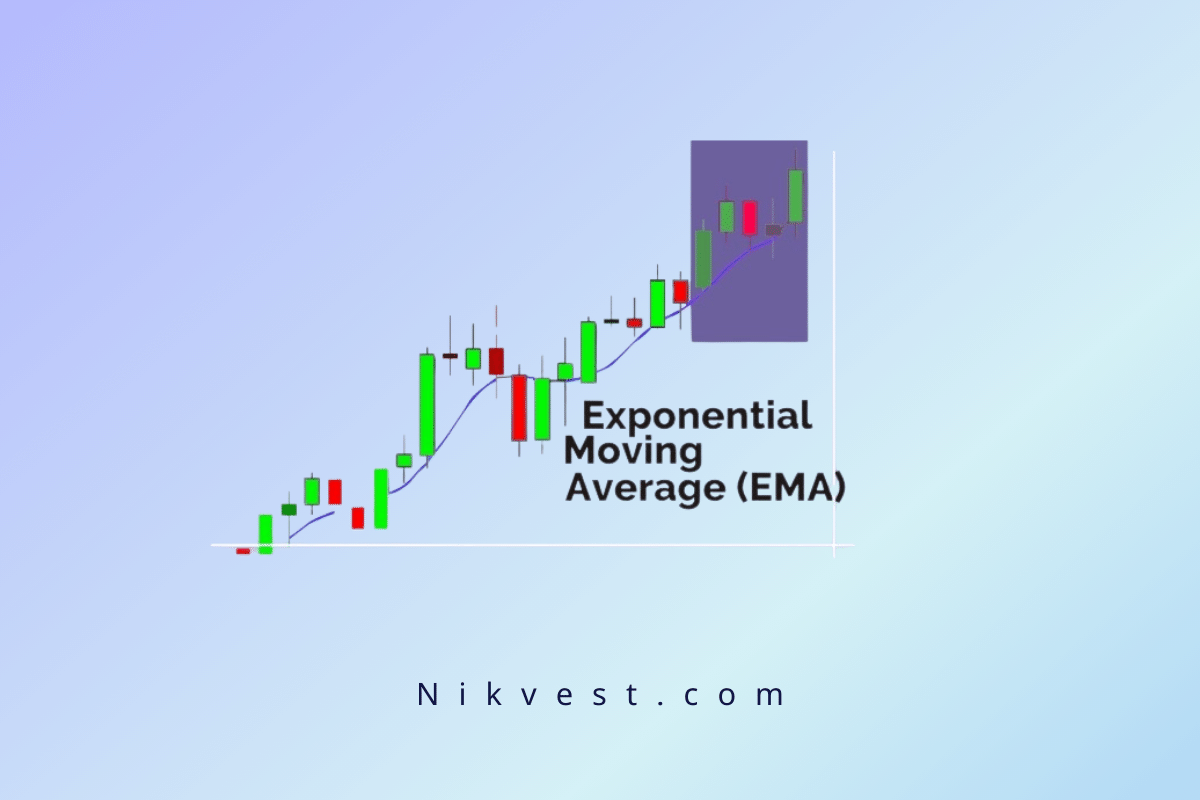
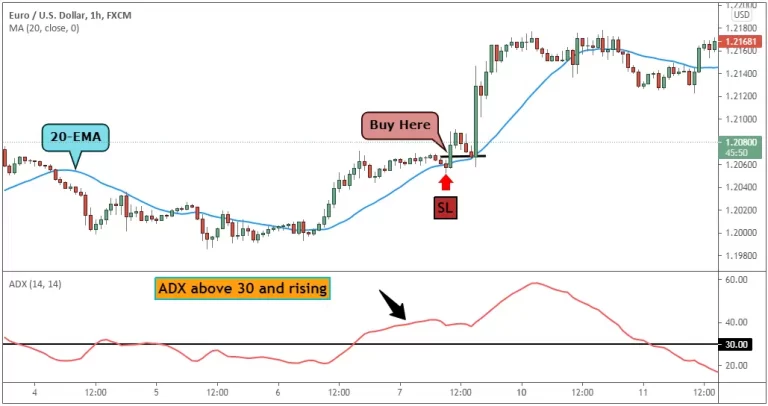
In the following example, we use the “Holy Grail” strategy based on the ADX indicator and the 20-period EMA (Exponential Moving Average). This strategy is taken from the book Street Smarts by Larry Connors and Linda Raschke.
If you want to use this trading strategy to generate signals with the ADX indicator, you need to follow these simple rules:
- ADX must cross above 30 – this indicates a trending market.
- Wait for the price to reach the 20-EMA.
- When the price reaches the 20-EMA, place a buy order above the previous bar.
- Set the stop-loss below the newly formed swing low, as shown in the image below.
ADX Indicator Settings
Setting Up and Configuring the Average Directional Index (ADX) Indicator in MT4
This guide assumes that you have already opened a chart in MT4.
After reading this MetaTrader 4 tutorial, you should be able to:
- Add the ADX indicator and configure its parameters.
- Modify the parameters.
- Remove the ADX indicator.
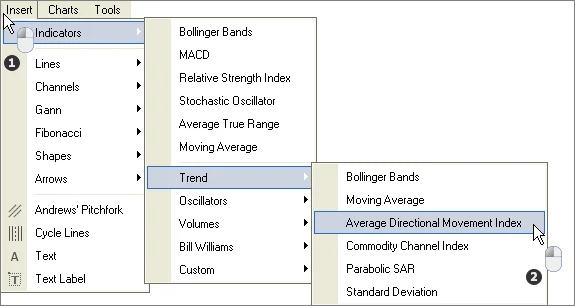
Add the ADX Indicator and Configure Its Parameters
- Click on Insert and hover your mouse over Indicators and then Trend.
- Click on Average Directional Movement Index.

Configuring General Parameters
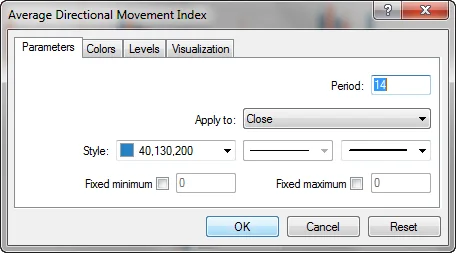
After completing the steps above, the settings menu will appear. Several common parameters can be used to control most indicators.

There are two types of parameters:
- Indicator Calculations: For example, the number of periods used for ADX (initially, you don’t need to worry too much about this).
- Visual Settings for an Indicator: For example, how it appears, the color and thickness of the lines, etc.
Changing Parameters for Future Use
To change the indicator settings directly on the chart for future use:
- Right-click on the ADX indicator (make sure you are exactly on the indicator line to view the following menu).
- Select ADX (14) Properties. The number 14 refers to the Periods parameter and can vary depending on your choice when setting up the parameters.
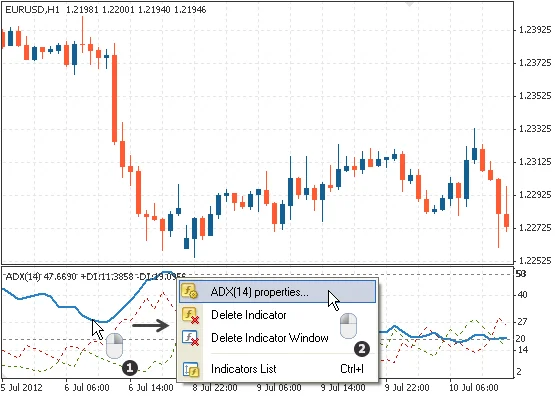
The parameter menu will reappear, as shown in the image below, where you can change the indicator parameters.
Removing the ADX Indicator from the Chart
To remove ADX:
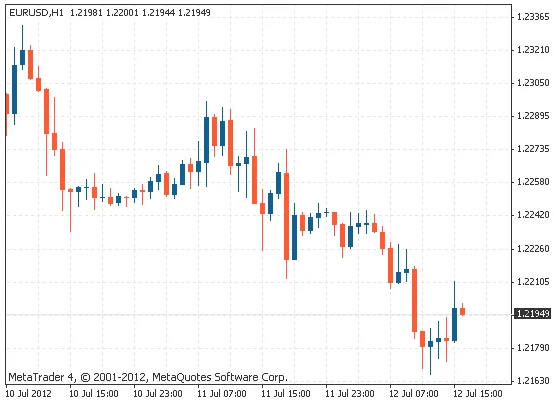
- Right-click on the indicator you want to remove (you must click directly on the indicator line to get the following menu).
- Click on Delete Indicator.
As shown in the image below, the Average Directional Index (ADX) indicator will be removed from the chart after these steps are completed.
Final Words
Technical analysis is recognized as one of the prominent methods for identifying investment opportunities in the stock market. Various tools are used in this field, including indicators, which are some of the most widely used.
The ADX indicator is one of these tools that helps traders identify buy and sell signals. As a trend indicator, ADX, through the use of DI+ and DI- curves, allows for a precise evaluation of assets.
To effectively use this tool, it is recommended to first analyze the strength of the asset’s trend using the ADX curve and then determine the trend direction by examining the two DI curves. This approach helps you identify suitable entry and exit points in various trades more effectively.