Heiken Ashi Candlestick Strategy
In the ever-evolving world of trading, market participants are constantly seeking tools and strategies that can help them make informed decisions. One such tool that has gained widespread popularity, especially for trend identification and technical analysis, is the Heiken Ashi candlestick chart. It is not just an alternative to the traditional candlestick chart but a tool that provides traders with a much clearer picture of the ongoing price trends and market sentiment.
In this comprehensive guide, we will dive into the Heiken Ashi candlestick strategy, explore how it works, how to read the charts, and how to implement this technique into your trading strategy for better results. We will also discuss the pros and cons of using Heiken Ashi and how you can combine it with other indicators for optimal performance.
What is Heiken Ashi?
The Heiken Ashi chart, a Japanese technique, translates to “average pace” in English. The primary purpose of this chart is to smooth price action by averaging data over a set period of time. While traditional candlestick charts provide open, high, low, and close data based on specific time intervals, Heiken Ashi uses a formula to average the price data, resulting in a more visually coherent and less noisy chart.
This method eliminates the typical market “noise” found in volatile price swings and helps traders see trends more clearly, making it easier to decide when to enter or exit trades. The Heiken Ashi chart is particularly favored by traders who focus on trend-following strategies.
Heiken Ashi Formula Explained
To understand why the Heiken Ashi candlesticks are smoother than regular candlesticks, it’s essential to look at the formula used to create each Heiken Ashi candlestick:
- Close price = (Open + High + Low + Close) / 4
- Open price = (Previous Open + Previous Close) / 2
- High price = Max(High, Open, Close)
- Low price = Min(Low, Open, Close)
The Heiken Ashi chart provides a more uniform representation of the price action because it recalculates the open and close prices using an average of the previous and current periods, while the high and low prices take the maximum and minimum of the relevant values. This smoothing effect helps reduce small fluctuations, making it easier to spot trends.
How to Read Heiken Ashi Charts
Understanding how to read Heiken Ashi charts is the first step toward utilizing them effectively. Here are the key elements to watch out for:
-
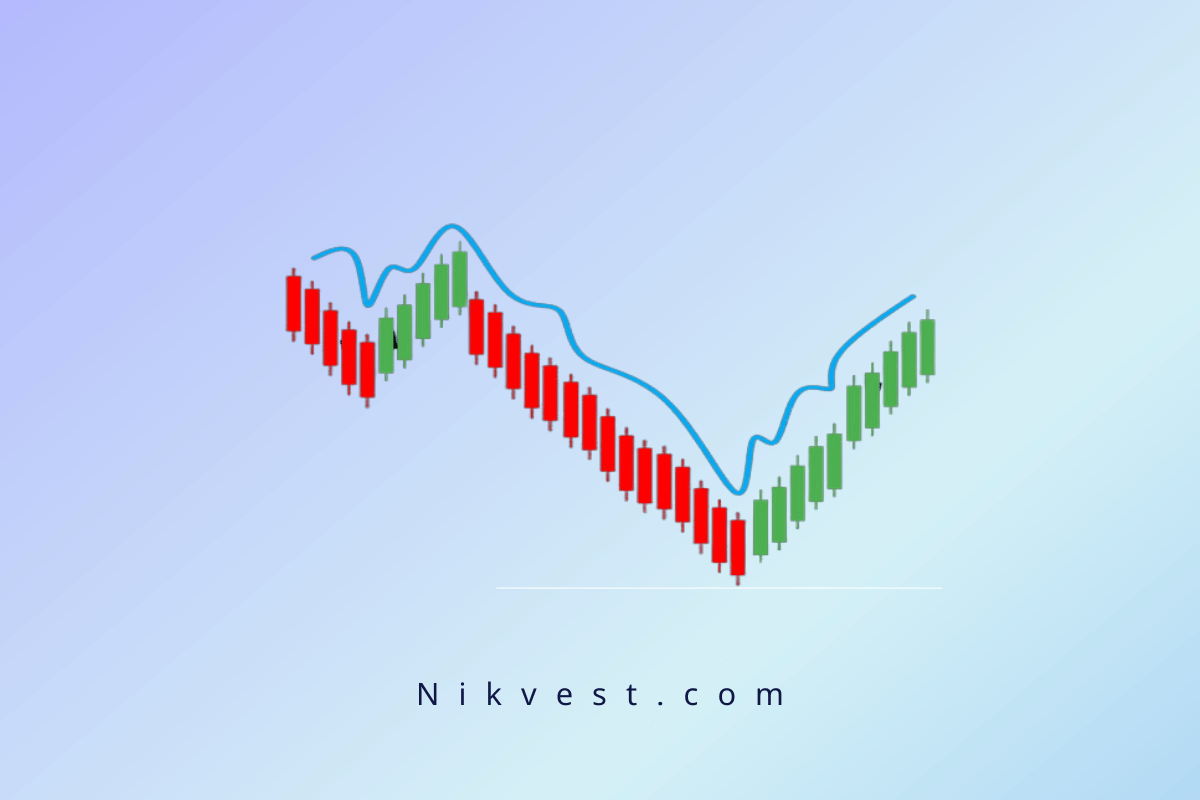
Strong Uptrend (Bullish Trend)
– Green or white (depending on the platform’s color scheme) Heiken Ashi candles without lower shadows generally indicate a strong bullish trend.
– The absence of lower shadows means that the price consistently closes higher than it opens, showing strength and upward momentum.
– As long as the Heiken Ashi candles remain green with no lower shadows, the uptrend is likely to continue.
-
Strong Downtrend (Bearish Trend)
– Red Heiken Ashi candles with no upper wicks represent a strong bearish trend.
– The absence of upper wicks suggests that sellers are in control, and prices are consistently closing lower than they open.
– As long as the red candles keep appearing without upper wicks, it signals a continuation of the downtrend.
-
Reversal and Consolidation Patterns
– A Heiken Ashi candle with a small body and long shadows on both sides indicates indecision in the market, which often precedes a trend reversal or consolidation phase.
– When a trend loses its strength, the candlestick bodies become smaller, and shadows become more prominent on both sides. This signifies that the market may be preparing for a reversal or that the trend is weakening.
-
Weakening Trend
– Heiken Ashi candles that have shadows on both ends but still follow the same color pattern (green for uptrend, red for downtrend) indicate that the trend may be losing steam.
– These candles often appear when the market is in a consolidation phase or when price action is choppy, suggesting that a trend reversal could occur soon.
- Doji Candles
– A Doji candle on a Heiken Ashi chart (a small body with shadows on both sides) is an important reversal signal. It represents a balance between buyers and sellers and often appears after a strong trend.
– Traders typically wait for confirmation before acting on a Doji, as it indicates indecision in the market.
Heiken Ashi Candlestick Strategy
Now that you understand how to read Heiken Ashi candles, let’s explore how to implement this tool into a trading strategy. The Heiken Ashi strategy is primarily a trend-following approach, but it can also be used for identifying potential trend reversals and consolidation phases.
-
Trend Identification
The primary advantage of the Heiken Ashi chart is its ability to make trends more visible by filtering out the noise. This feature is particularly useful for traders who follow the trend as part of their strategy.
– Bullish Trend: When green Heiken Ashi candles dominate the chart, especially when they lack lower shadows, it indicates a strong bullish trend. Traders should consider entering a buy position when this pattern emerges.
– Bearish Trend: Red Heiken Ashi candles, especially those without upper shadows, indicate a strong bearish trend. This pattern signals a good opportunity to enter a sell position.
- Entry and Exit Signals
One of the best ways to utilize Heiken Ashi candles is to use them for entry and exit points based on the trend’s strength. Here’s how:
– Buy Signal: Enter a long (buy) position when a series of green candles appear, especially if they have no lower shadows. This indicates that the market is in a strong uptrend.
– Sell Signal: Enter a short (sell) position when a series of red candles appear without upper shadows, signaling a strong downtrend.
– Exit Signals: Consider exiting the position when the Heiken Ashi candles begin to show signs of reversal, such as the appearance of Doji-like candles (small bodies with long shadows) or a change in candle color.
-
Combining Heiken Ashi with Other Indicators
While Heiken Ashi provides a clearer picture of trends, it is often used in conjunction with other technical indicators to confirm entry and exit signals. Some popular indicators to pair with Heiken Ashi include:
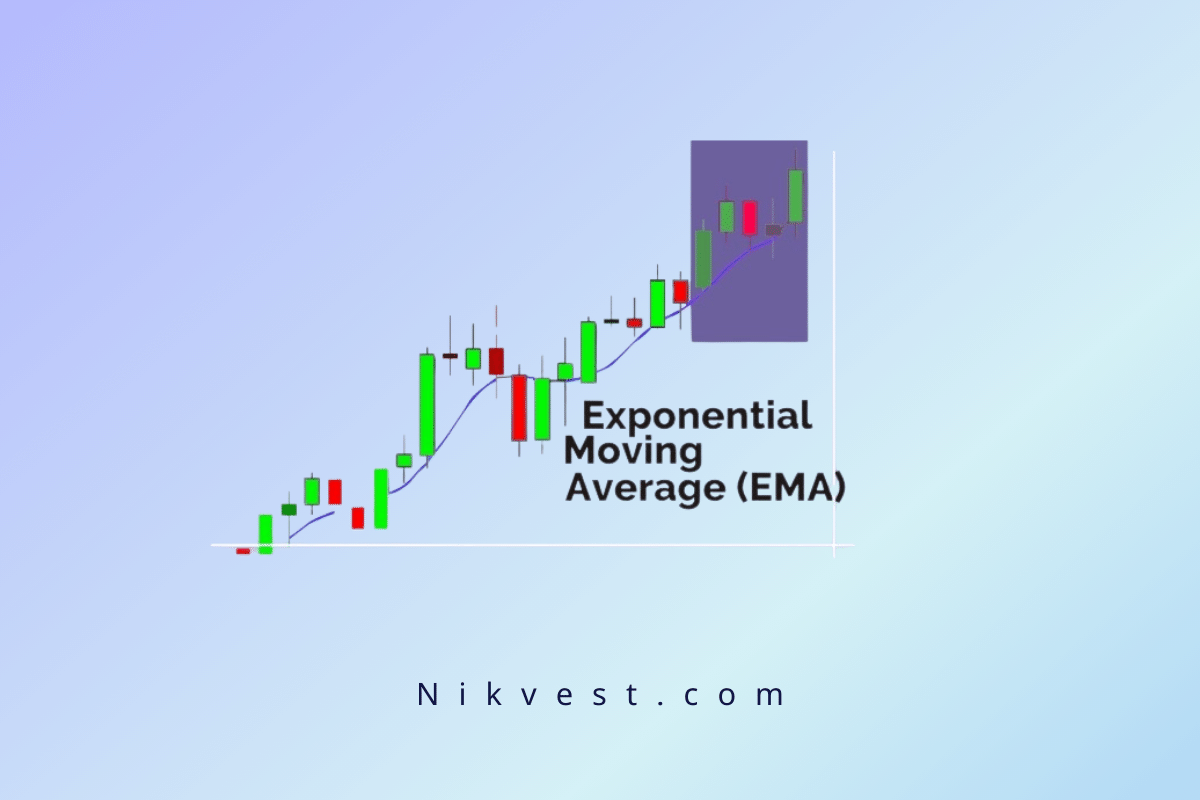
– Moving Averages (MA): Overlaying a moving average on a Heiken Ashi chart can help confirm the direction of the trend. For instance, if green Heiken Ashi candles are above a 50-period moving average, it can strengthen the buy signal.
– Relative Strength Index (RSI): RSI can help identify overbought and oversold conditions. When combined with Heiken Ashi, traders can avoid buying into overbought conditions or selling into oversold conditions.
– MACD (Moving Average Convergence Divergence): MACD is an excellent momentum indicator to use alongside Heiken Ashi. When MACD lines cross in the direction of the trend (bullish or bearish), it can offer additional confirmation.
-
Trailing Stop-Loss
Incorporating a trailing stop-loss into your strategy can help protect profits while allowing for potential further gains. As the trend continues, you can move the stop-loss along with the trend, ensuring that you exit the trade if the market reverses.
-
Timeframes and Heiken Ashi
The Heiken Ashi chart works best on longer timeframes, such as the 4-hour, daily, or weekly charts. In these timeframes, the smoothing effect of the Heiken Ashi candles makes trends more apparent and reduces the likelihood of false signals.
However, using Heiken Ashi on shorter timeframes (such as 1-minute or 5-minute charts) may lead to more false signals due to the reduced amount of price data being averaged, making it less reliable for short-term trades.
Heiken Ashi vs Traditional Candlestick Charts
Many traders wonder how Heiken Ashi differs from traditional candlestick charts and which one is better. The answer depends on your trading style and goals.
– Traditional Candlesticks: Traditional candlestick charts show real-time price action, including open, high, low, and close data for each period. They are more accurate for pinpointing entry and exit points and are favored by short-term traders and scalpers who need precise information.
– Heiken Ashi: Heiken Ashi smooths the price data by averaging it over time, making trends more visible but also introducing a lag. This lag is often beneficial for traders who want to hold positions longer and avoid reacting to minor fluctuations.
Pros of Heiken Ashi
-
Smoother Trends
One of the primary advantages of Heiken Ashi is that it smooths out market noise, making trends easier to spot. By averaging the price data, Heiken Ashi eliminates much of the volatility found in traditional candlestick charts, helping traders stay focused on the broader market direction without being distracted by minor fluctuations.
-
Clearer Trend Identification
The Heiken Ashi chart excels at highlighting trends. When the candles are consistently green (bullish) or red (bearish) without opposing wicks, it provides a clear indication of the strength and direction of the trend. This makes it easier for traders to stay in a position longer during a strong trend, helping them maximize their profits.
-
Reduced Market Noise
By averaging the open, close, high, and low prices, Heiken Ashi provides a cleaner view of the market. This makes it especially useful for avoiding the confusion caused by erratic price movements, which are common in highly volatile markets.
-
Ideal for Trend-Following Strategies
Heiken Ashi is particularly useful for traders who follow trend-based strategies. It allows them to identify the beginning and end of trends more easily, providing more confidence in their entries and exits. This is beneficial for swing traders and long-term trend followers who want to avoid the short-term noise that often triggers premature exits.
-
Visual Simplicity
The simplicity of the Heiken Ashi chart makes it an excellent tool for beginners who are still learning how to interpret price action. The smoother appearance of the candles reduces the complexity of the analysis, making it easier to identify trading opportunities.
-
Helps with Emotional Control
By filtering out the market’s smaller fluctuations, Heiken Ashi can help traders manage their emotions. Since the chart focuses on the overall trend rather than each individual price movement, traders are less likely to make emotional decisions based on short-term volatility.
Cons of Heiken Ashi
-
Lagging Indicator
The biggest drawback of Heiken Ashi is that it is a lagging indicator. Because the candles are based on averaged price data, they tend to reflect past price action rather than current market conditions. This lag can cause traders to enter or exit trades late, potentially missing out on ideal entry and exit points.
-
Less Accurate for Real-Time Price Data
Heiken Ashi candles do not display the exact open, close, high, or low prices for each period. This lack of real-time data can be a disadvantage, especially for day traders or scalpers who need precise information to time their trades accurately.
-
Not Suitable for Short-Term Trading
Due to its smoothing effect, Heiken Ashi is not as effective in shorter timeframes, such as 1-minute or 5-minute charts. In these timeframes, the lag in the data can lead to false signals, making it more challenging for traders to react quickly to market changes. It is better suited for longer timeframes, such as 4-hour, daily, or weekly charts.
-
Limited Use in Range-Bound Markets
Heiken Ashi performs best in trending markets. When the market is in a range-bound or sideways phase, the smoothing effect can result in confusing or inaccurate signals. In these conditions, traditional candlestick charts may offer more clarity.
-
Requires Additional Confirmation
While Heiken Ashi provides valuable insights into trends, it should not be used as a standalone tool for making trading decisions. It’s essential to pair Heiken Ashi with other technical indicators, such as moving averages, RSI, or MACD, to confirm signals and reduce the likelihood of false entries or exits.
-
Can Miss Reversals
Due to the averaging method, Heiken Ashi candles might delay the detection of trend reversals. Traders may continue to see a series of green or red candles even as the market is beginning to reverse. This makes it critical to use other indicators or chart patterns to identify potential turning points in the market.
The Heiken Ashi chart offers a valuable tool for traders, especially those who focus on trend-following strategies. Its ability to smooth out price action and reduce noise makes it easier to identify trends and stay in trades longer. However, it’s important to be aware of its limitations, such as its lagging nature and lack of real-time price accuracy.
Traders should use Heiken Ashi in combination with other indicators and tailor it to their specific trading style and timeframes to maximize its effectiveness. While it’s an excellent tool for spotting trends, it’s not ideal for short-term or range-bound market conditions, and additional confirmation is always recommended.
Advanced Heiken Ashi Strategies
For traders who want to take their Heiken Ashi strategy to the next level, there are several advanced methods and tools that can help maximize the effectiveness of this approach. Let’s take a look at a few of these strategies:
-
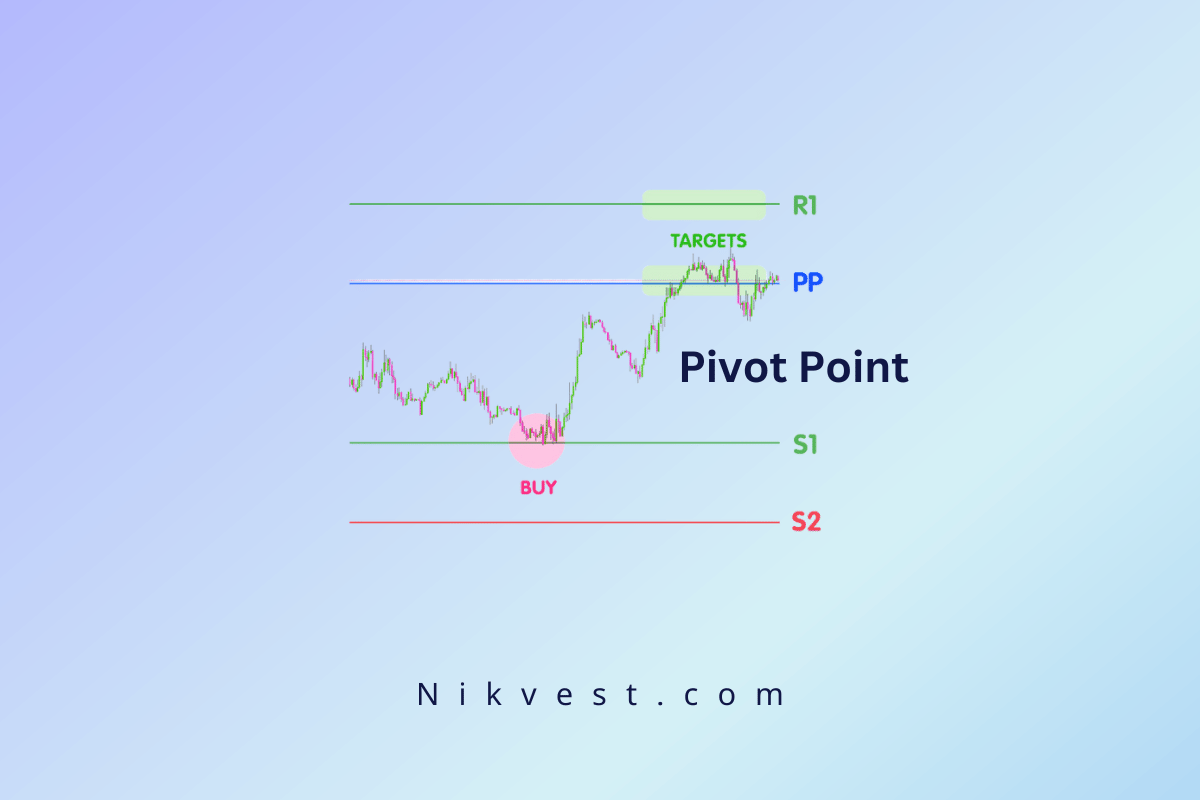
Using Heiken Ashi with Support and Resistance Levels
Support and resistance levels are fundamental concepts in technical analysis. These levels represent price points where the market has historically shown tendencies to reverse or consolidate. By combining Heiken Ashi with well-defined support and resistance levels, traders can make more informed decisions about when to enter or exit trades.
– Entering Trades: If a series of green Heiken Ashi candles forms above a key resistance level, this could signal a strong breakout. Conversely, red candles forming below a support level may signal a breakdown, indicating a potential short-selling opportunity.
– Exiting Trades: Traders can use support and resistance to identify optimal exit points, especially when the market approaches a known level of support or resistance while the Heiken Ashi chart signals a weakening trend.
-
Heiken Ashi and Fibonacci Retracement
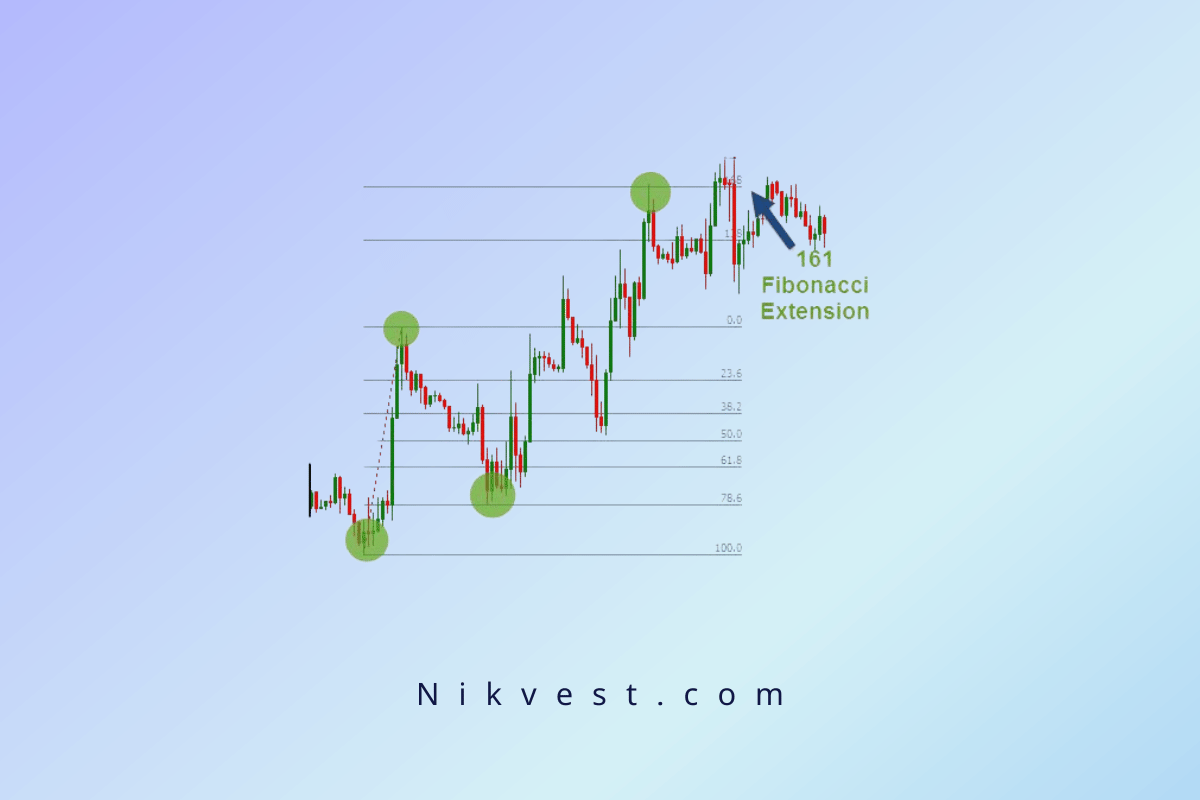
The Fibonacci retracement tool is a popular indicator used to identify potential reversal points based on key Fibonacci levels (23.6%, 38.2%, 50%, 61.8%, and 78.6%). Heiken Ashi can be combined with Fibonacci retracement levels to help confirm reversals and pullbacks in trending markets.
– Entry Points: After a strong bullish trend, if the price pulls back to a key Fibonacci level (such as 38.2% or 50%) and green Heiken Ashi candles start to form, it may be a good time to enter a buy trade. Similarly, in a bearish trend, a retracement to a Fibonacci level followed by red Heiken Ashi candles could present a shorting opportunity.
– Confirmation of Reversal: The appearance of Doji-like Heiken Ashi candles near Fibonacci levels can provide additional confirmation that the market is ready to reverse.
-
Heiken Ashi and Trendlines
Trendlines are essential tools for spotting the direction of the market. Drawing trendlines on a Heiken Ashi chart helps traders visualize the overall trend and identify potential breakout points.
– Uptrend: Draw a trendline connecting the lows of the price during an uptrend. If Heiken Ashi green candles consistently bounce off this trendline, it shows the trend’s strength.
– Downtrend: In a bearish market, draw a trendline connecting the highs of the price. Red Heiken Ashi candles respecting this line signal the continuation of the downward trend.
– Breakout Strategy: When the price breaks above or below the trendline and is confirmed by Heiken Ashi candles, it may signal a potential trend reversal or breakout.
-
Heiken Ashi and RSI (Relative Strength Index) Divergence
The RSI is a momentum oscillator that measures the speed and change of price movements. RSI divergence occurs when the price of an asset is moving in the opposite direction of the RSI, signaling a potential reversal.
– Bullish Divergence: In a bullish divergence, the price is making lower lows, but the RSI is making higher lows. If green Heiken Ashi candles start forming after a bullish divergence, it strengthens the case for a trend reversal to the upside.
– Bearish Divergence: In a bearish divergence, the price is making higher highs, while the RSI is making lower highs. Red Heiken Ashi candles following a bearish divergence indicate a stronger likelihood of a downward reversal.
Common Mistakes to Avoid When Using Heiken Ashi
Like any trading strategy or tool, Heiken Ashi is not foolproof. Traders, especially beginners, should be aware of common pitfalls when implementing this strategy:
- Relying Solely on Heiken Ashi
While Heiken Ashi can provide a smoother and clearer view of market trends, relying solely on this chart type without the use of other technical indicators can be dangerous. It’s crucial to use Heiken Ashi in conjunction with additional tools such as moving averages, RSI, or support and resistance levels to confirm trading signals.
-
Ignoring Market Context
Heiken Ashi charts work best in trending markets. Using this chart type in choppy, range-bound markets can lead to false signals. Traders should be aware of the overall market conditions before placing trades based on Heiken Ashi candles alone.
- Misinterpreting Reversal Signals
Doji-like Heiken Ashi candles can indicate indecision or a potential trend reversal. However, not every Doji candle results in a reversal. Always confirm the reversal signal using other indicators like RSI or moving averages before entering a trade.
- Overlooking Risk Management
No matter how strong a trend appears on a Heiken Ashi chart, there is always the risk of sudden reversals. Always use stop-loss orders and follow proper risk management practices to protect your trading capital.
Heiken Ashi for Swing Trading
Swing traders, who aim to capture short- to medium-term price movements, often find Heiken Ashi particularly useful. The chart’s ability to smooth out price action helps swing traders stay in trades for longer periods without getting shaken out by minor price fluctuations.
– Identifying Trend Swings: Swing traders can use Heiken Ashi to identify the start and end of trends by waiting for a series of Heiken Ashi candles to form in the same direction.
– Holding Trades Longer: The smoothing effect of Heiken Ashi allows traders to avoid early exits caused by small pullbacks or corrections. Instead, they can hold their position longer until a confirmed reversal occurs, maximizing profits.
Heiken Ashi for Day Trading
While Heiken Ashi is commonly used for longer timeframes, day traders can also benefit from its clarity on shorter intervals such as the 15-minute or hourly charts. However, it’s essential to be mindful of the limitations that arise from the lagging nature of Heiken Ashi in fast-moving markets.
– Short-Term Trend Identification: Day traders can use Heiken Ashi to quickly spot emerging trends within a trading day. Once a clear trend is established, traders can ride the trend and use trailing stops to lock in profits.
– Avoiding Whipsaws: Heiken Ashi’s ability to smooth out noise is beneficial for day traders trying to avoid whipsaws—rapid price movements that trigger premature exits.
Heiken Ashi for Cryptocurrency Trading
Cryptocurrency markets are known for their high volatility, making traditional candlestick charts difficult to interpret. Heiken Ashi is a valuable tool for crypto traders who want to filter out the noise and focus on the underlying trend.
– Trend Filtering: In markets like Bitcoin and Ethereum, where price swings are common, Heiken Ashi can help crypto traders identify strong trends and stay in trades longer.
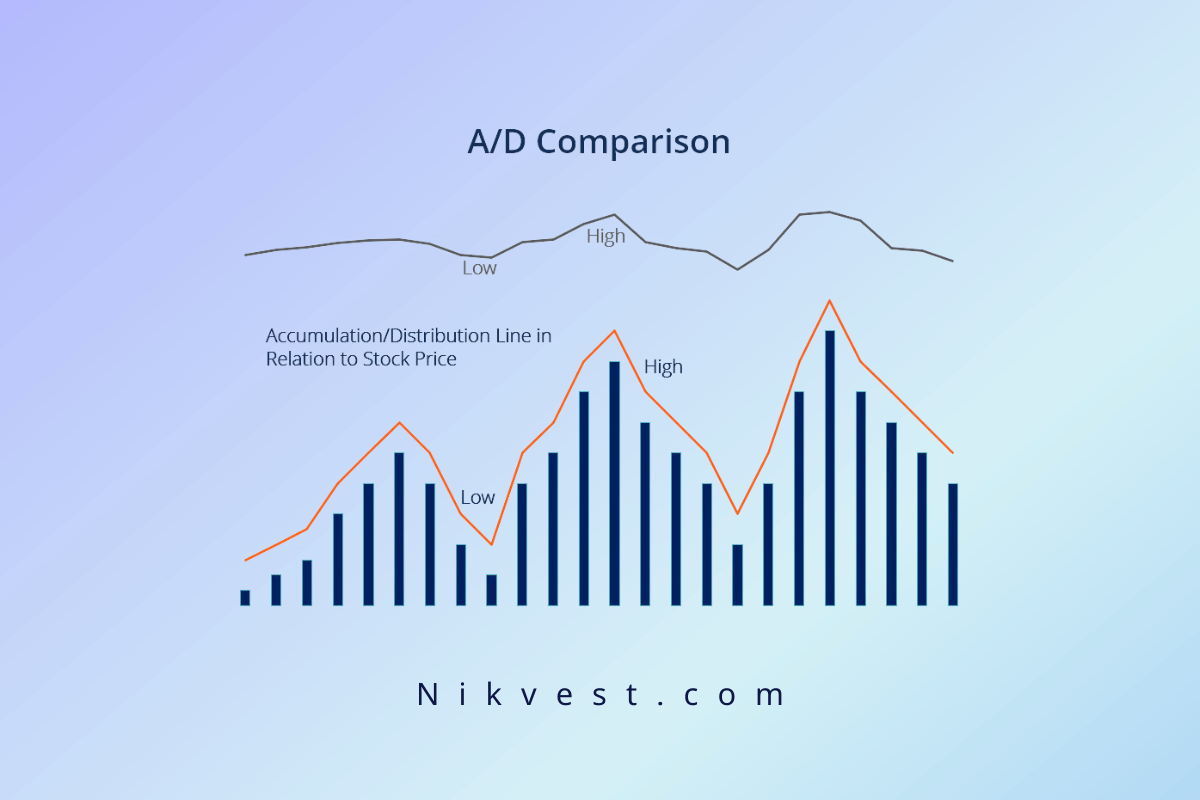
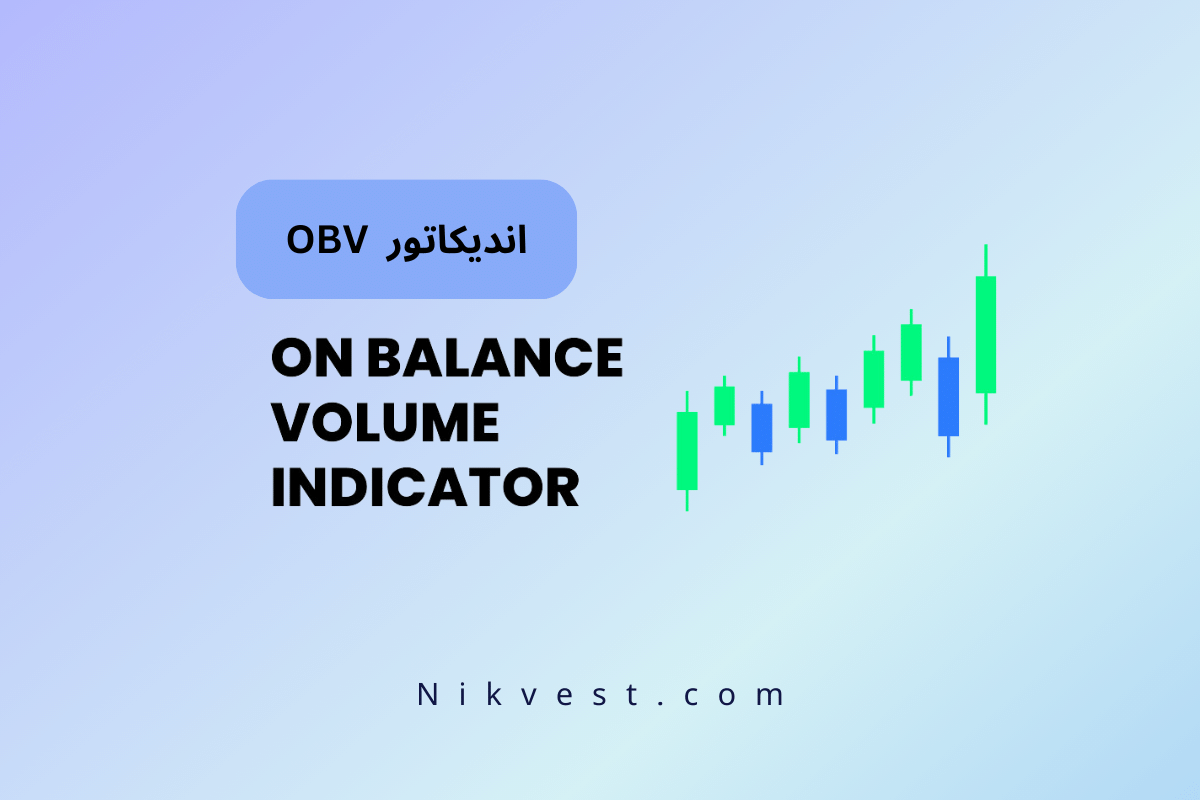
– Pairing with Volume Indicators: In the cryptocurrency market, volume plays a critical role in confirming trends. Combining Heiken Ashi with volume indicators, such as the On-Balance Volume (OBV) or Volume Weighted Average Price (VWAP), can help traders confirm whether a trend is supported by buying or selling pressure.
Conclusion: Mastering Heiken Ashi for Trading Success
The Heiken Ashi candlestick strategy is a powerful tool that helps traders identify trends, avoid market noise, and stay in trades longer. Its smoothing effect is ideal for both beginner and experienced traders, particularly those who follow a trend-based trading approach. While Heiken Ashi offers several advantages, including clearer trend identification and less noise, it’s essential to combine it with other technical indicators for confirmation and to mitigate the risk of false signals.
By practicing patience, using proper risk management, and combining Heiken Ashi with other tools like moving averages, RSI, and support/resistance levels, traders can significantly improve their trading decisions and profitability. Whether you’re trading stocks, forex, or cryptocurrencies, the Heiken Ashi strategy offers a versatile and effective method for navigating the markets with greater confidence.