
Candlestick Pattern Trading Strategy
Candlestick patterns have long been a crucial tool for traders in understanding market sentiment and predicting future price movements. These patterns offer a visual representation of price data over specific timeframes, providing traders with key insights into whether a particular asset may rise or fall. First introduced by Japanese rice traders in the 18th century, candlestick charts and patterns have evolved into one of the most widely used technical analysis tools across different markets, including stocks, forex, commodities, and cryptocurrencies.
In this comprehensive article, we will delve into the intricacies of candlestick pattern trading strategies, the different types of patterns, and how traders can leverage these insights to make informed decisions.
Understanding Candlestick Charts
A candlestick chart is made up of individual “candles,” each representing price movement within a specified period.
Candles display four key price points:
- Open price: The price at which the asset started trading during that period.
- Close price: The price at which the asset finished trading during that period.
- Highprice: The highest price reached during the period.
- Low price: The lowest price reached during the period.
The body of the candlestick represents the difference between the open and close prices, while the wicks (also known as shadows) extend from the body to indicate the high and low prices. Candlesticks can either be bullish (where the close price is higher than the open) or bearish (where the close price is lower than the open). The color of the candlestick—commonly green or white for bullish and red or black for bearish—quickly signals market sentiment.
While each individual candlestick can provide some insight into market direction, the true power of candlestick charts comes from recognizing specific patterns that can indicate reversals, continuations, or indecision in the market.
Why Candlestick Patterns Matter
Candlestick patterns are an effective way to gauge the sentiment of market participants. By recognizing these patterns, traders can anticipate potential changes in trends, identify entry and exit points, and manage risk more effectively. Unlike simple line or bar charts, which only show price levels, candlestick patterns offer a visual and psychological layer to price action.
For instance, a single candlestick with a long lower wick and a small body (a hammer pattern) may suggest that buyers have stepped in to support prices after a period of selling pressure. On the other hand, a pattern formed by multiple candlesticks, such as the bullish engulfing pattern, can suggest a shift from a bearish to a bullish trend.
The appeal of candlestick patterns lies in their simplicity and the valuable information they convey. However, they are not foolproof and should be used in conjunction with other technical indicators to confirm the signals they provide.
The Anatomy of a Candlestick: A Closer Look
Before diving into specific candlestick patterns, it’s essential to understand the anatomy of a single candlestick. Each candle provides valuable information about the market during a given period:
- Body: The rectangular section between the open and close prices. A longer body indicates a more significant price move, showing stronger buying or selling momentum.
- Wicks (Shadows): The thin lines above and below the body represent the highest and lowest prices traded during the period. Long wicks suggest potential rejection of higher or lower prices, indicating indecision in the market.
- Color: The color of the candle (typically green/white for bullish and red/black for bearish) indicates whether the price moved up or down during the period.
Understanding this basic structure is crucial for interpreting candlestick patterns and applying them to your trading strategy.
Types of Candlestick Patterns
Candlestick patterns are broadly categorized into two types: reversal patterns and continuation patterns. Reversal patterns indicate a potential change in the trend, while continuation patterns suggest that the current trend will continue. Both types are crucial for identifying trading opportunities.
Single-Candle Patterns
These patterns consist of just one candlestick and provide valuable insights into short-term market sentiment.
Doji: The Doji is one of the most well-known candlestick patterns, characterized by a small or non-existent body. This occurs when the open and close prices are nearly the same, indicating indecision in the market. A Doji signals that neither the buyers nor the sellers are in control. Depending on the preceding trend, a Doji can suggest a potential reversal.
- Bullish Doji: When a Doji appears after a downtrend, it signals that selling momentum might be weakening and a bullish reversal could be imminent.
- Bearish Doji: When a Doji appears after an uptrend, it may indicate that buyers are losing control, potentially leading to a bearish reversal.
Hammer: The hammer is a bullish reversal pattern that forms after a downtrend. It has a small body and a long lower wick, showing that although sellers initially pushed prices lower, buyers stepped in and drove prices back up by the end of the period. This indicates a potential change in momentum from bearish to bullish.
- Inverted Hammer: Similar to the hammer, but with a long upper wick and a small body. The inverted hammer is also a bullish reversal pattern, suggesting that buying pressure could reverse the previous downtrend.
- Shooting Star: This is the bearish counterpart of the inverted hammer, appearing after an uptrend. The shooting star has a long upper wick and a small body, signaling that buyers pushed prices higher but were ultimately overpowered by sellers. This indicates a potential bearish reversal.
Multi-Candle Patterns
These patterns consist of two or more candlesticks and are often more reliable than single-candle patterns, as they provide more context regarding market sentiment.
Engulfing Patterns: Engulfing patterns are powerful reversal signals consisting of two candles. The second candle completely engulfs the body of the first candle, indicating a shift in market momentum.
- Bullish Engulfing: This pattern appears after a downtrend and is characterized by a small bearish candle followed by a large bullish candle. The large bullish candle “engulfs” the previous bearish candle, suggesting that buyers have taken control and a reversal is likely.
- Bearish Engulfing: The opposite of the bullish engulfing pattern, this appears after an uptrend. A small bullish candle is followed by a larger bearish candle, indicating that sellers have overtaken the market, and a bearish reversal may follow.
Morning Star and Evening Star: These are three-candle patterns that signal potential trend reversals.
- Morning Star: This bullish reversal pattern consists of three candles: a long bearish candle, a small indecision candle (often a Doji), and a long bullish candle. It signifies that selling pressure has weakened, and buyers are stepping in to push the market higher.
- Evening Star: The bearish counterpart to the morning star, this pattern appears after an uptrend and consists of a long bullish candle, a small indecision candle, and a long bearish candle. It signals that buying pressure is weakening, and sellers may take control.
Three White Soldiers and Three Black Crows: These patterns consist of three consecutive candles and indicate a continuation of the prevailing trend.
- Three White Soldiers: This bullish continuation pattern is formed by three long bullish candles, suggesting strong buying momentum and the continuation of an uptrend.
- Three Black Crows: This bearish continuation pattern consists of three consecutive bearish candles, indicating strong selling pressure and a likely continuation of the downtrend.
How to Trade Using Candlestick Patterns
Now that you understand the most popular candlestick patterns, the next step is learning how to use them in your trading strategy. While candlestick patterns can offer powerful insights, it’s important to apply them in the right context and with other forms of analysis to maximize their effectiveness.
Use Candlestick Patterns with Confirmation
One of the most common mistakes traders make is acting solely based on a candlestick pattern without waiting for confirmation. Confirmation refers to additional signals or price movements that validate the pattern. For example, after spotting a hammer candlestick, traders should wait for the next candle to close above the hammer’s high to confirm that a bullish reversal is underway.
Combine Candlestick Patterns with Technical Indicators
Candlestick patterns should be used in conjunction with other technical indicators to increase their reliability. For example, you can use the following popular indicators alongside candlestick analysis:
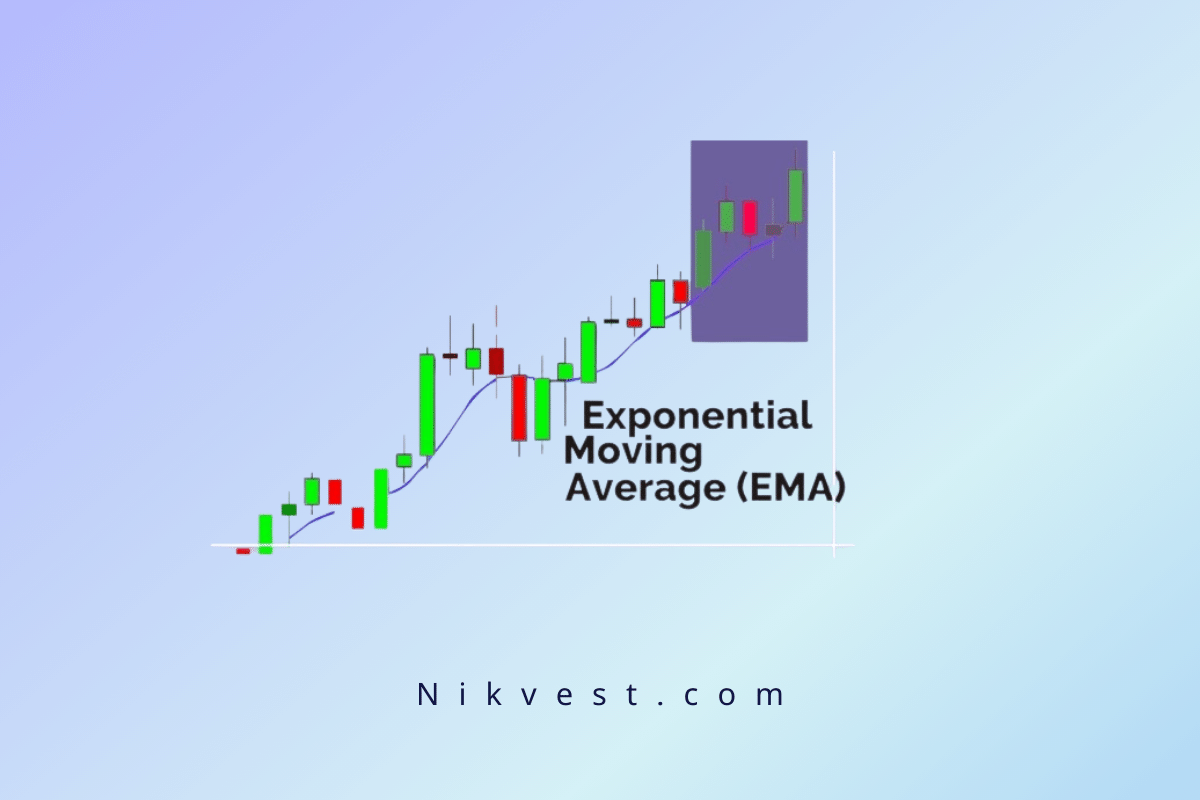
- Moving Averages: Moving averages can help confirm the trend direction. For instance, if a bullish engulfing pattern forms above a long-term moving average, it strengthens the signal of a potential upward move.
- Relative Strength Index (RSI): RSI helps identify overbought and oversold conditions. A candlestick reversal pattern that occurs in an oversold market (with an RSI below 30) can provide a strong buy signal.
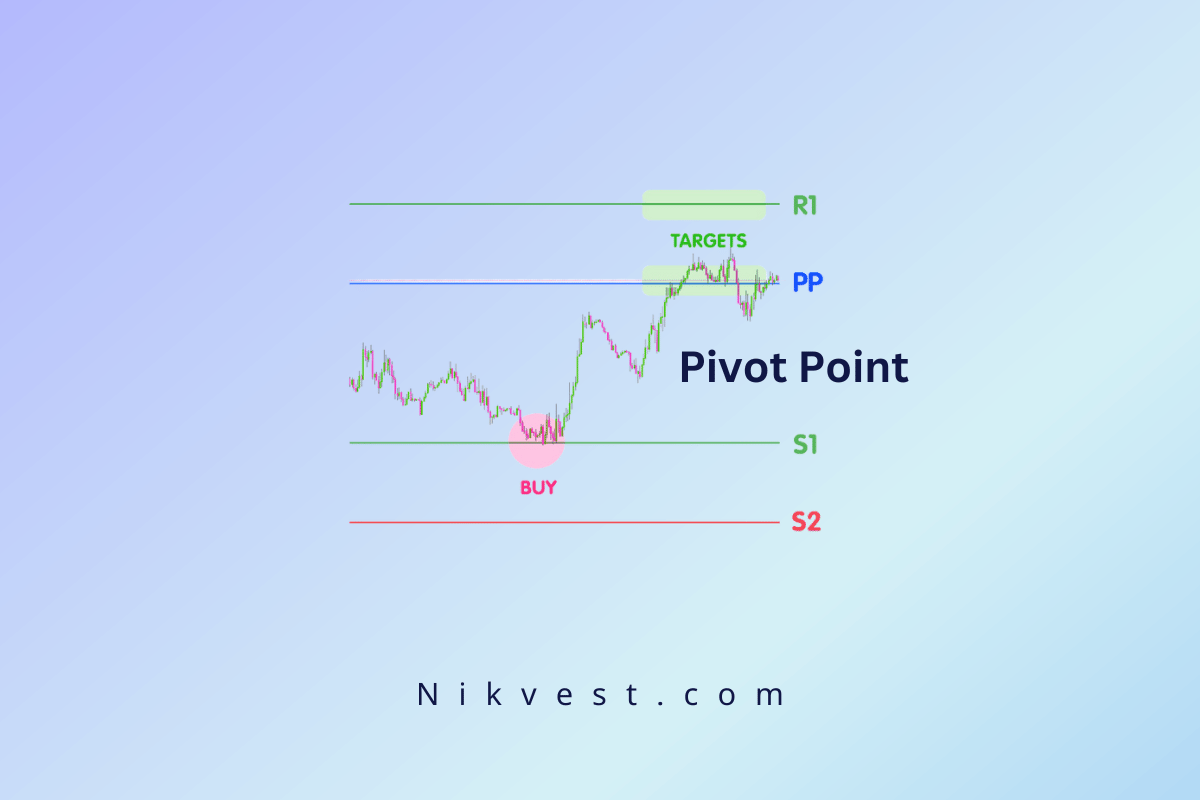
- Support and Resistance Levels: Candlestick patterns are more reliable when they occur near key support or resistance levels. A bullish reversal pattern near a support level or a bearish reversal near resistance suggests a stronger likelihood of a trend change.
Risk Management
Effective risk management is crucial when trading based on candlestick patterns. Always use stop-loss orders to protect your capital in case the market moves against your trade. For example, if you enter a trade based on a bullish reversal pattern like the hammer, you can place your stop-loss just below the low of the hammer’s wick. This way, if the market continues to decline, your losses will be minimized.
Timeframes Matter
timeframe in which they are observed. Longer timeframes, such as daily or weekly charts, carry more weight than shorter timeframes, like 1-minute or 5-minute charts. Patterns on longer timeframes often indicate broader market sentiment and are less prone to false signals, making them more reliable for trend reversals or continuations.
That said, shorter timeframes can be useful for fine-tuning entry and exit points within a larger trend. For instance, if you spot a reversal pattern on a daily chart, you might zoom into a 1-hour or 15-minute chart to look for confirmation or a more precise entry.
Combining Multiple Candlestick Patterns in a Strategy
While understanding individual candlestick patterns is crucial, combining multiple patterns can enhance the accuracy of your predictions and give you a better understanding of market sentiment. Here’s how you can create a well-rounded candlestick trading strategy:
Identify the Overall Trend
Before acting on any candlestick pattern, determine the overall trend of the market. Is the asset in an uptrend, downtrend, or range-bound? Use moving averages, trendlines, or other indicators to identify this. A pattern’s effectiveness is often higher when it aligns with the overall trend.
- Uptrend: Look for bullish continuation patterns like three white soldiers or bullish engulfing.
- Downtrend: Look for bearish continuation patterns like three black crows or bearish engulfing.
- Range-bound: Look for reversal patterns like the Doji or hammer, which can indicate a shift in sentiment at key support or resistance levels.
Look for Pattern Clusters
Patterns that appear in clusters or combinations can increase the probability of a successful trade. For example, a bullish engulfing pattern followed by a hammer within the same time period could provide stronger evidence of a potential upward reversal. Similarly, if multiple bearish signals appear, such as a shooting star followed by a bearish engulfing pattern, the likelihood of a price decline increases.
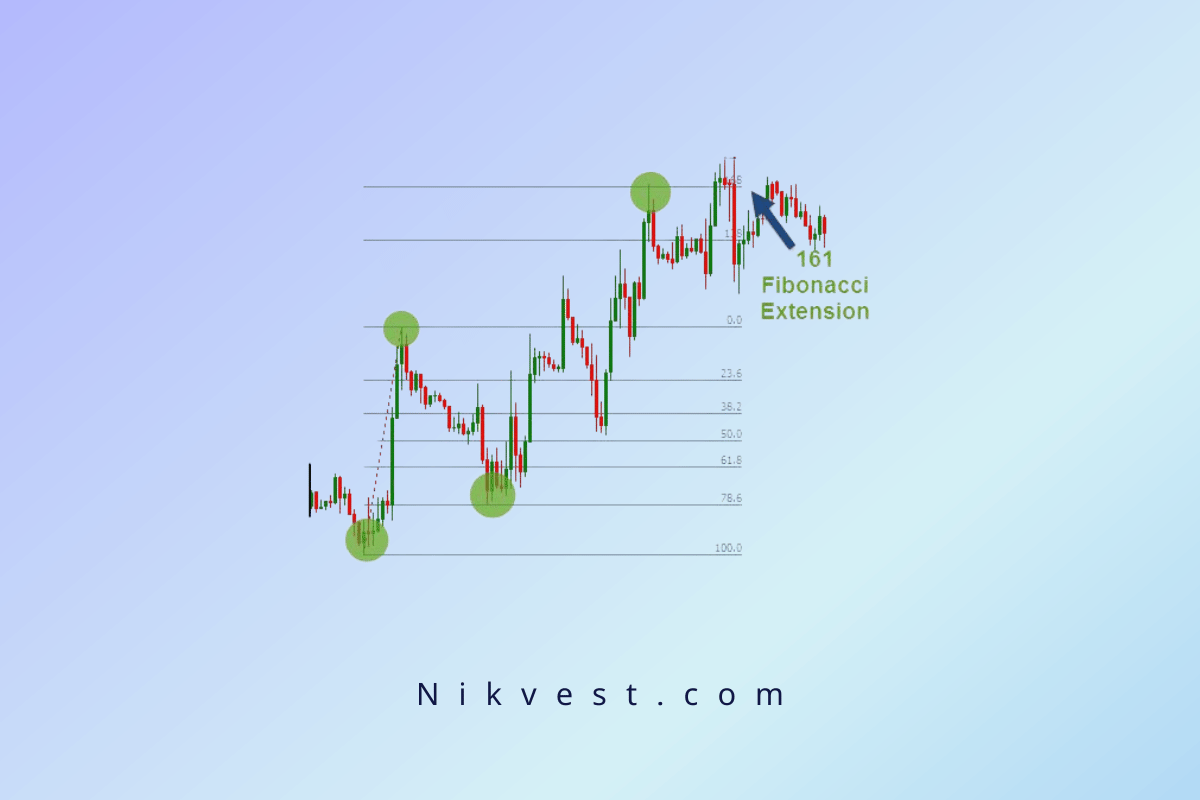
Use Fibonacci Retracement Levels
Fibonacci retracement levels can be combined with candlestick patterns to identify key levels of support and resistance. For example, after a strong upward move, you might wait for a retracement to the 38.2% or 50% Fibonacci level. If a bullish candlestick pattern, such as a hammer or bullish engulfing, forms at one of these levels, it can provide a stronger signal to enter the trade.
Volume Confirmation
Volume is a critical factor when confirming candlestick patterns. Higher trading volume during the formation of a reversal pattern, such as an engulfing pattern or morning star, adds credibility to the pattern. Conversely, low volume may suggest that the pattern is less reliable and could be a false signal.
For example, a bullish engulfing pattern on high volume is a strong indication that buyers are taking control of the market, increasing the likelihood of a price reversal. On the other hand, a similar pattern on low volume may indicate that there is not enough momentum to sustain the reversal, and the market could continue its previous trend.
Set Stop-Loss and Take-Profit Levels
No matter how confident you are in a pattern, risk management is essential to ensure that you don’t lose more than you’re willing to risk. Candlestick patterns can help you determine optimal stop-loss and take-profit levels:
- Stop-loss placement: For bullish reversal patterns like the hammer or bullish engulfing, place your stop-loss just below the low of the pattern. For bearish patterns like the shooting star or bearish engulfing, place your stop-loss just above the high of the pattern.
- Take-profit placement: Aim for a reasonable risk-reward ratio, typically 2:1 or higher. If your stop-loss is 50 pips below your entry, set your take-profit target at 100 pips or more.
Trade Management
Managing a trade is just as important as identifying entry and exit points. Once you’re in a trade, monitor it closely for signs of trend continuation or reversal. If the trade is going in your favor, consider adjusting your stop-loss to lock in profits as the market moves in your direction. You can also scale out of the position by taking partial profits at key resistance or support levels.
Advanced Candlestick Patterns and Strategies
While the patterns we’ve discussed are foundational, more advanced traders often seek out complex patterns that provide even more detailed insights into market sentiment. These patterns may involve combinations of several candlesticks or more nuanced interpretations of price action. Here are a few more advanced patterns to consider:
Harami Pattern
The Harami is a reversal pattern consisting of two candles. It occurs when the body of a small candle is entirely contained within the body of the previous larger candle.
- Bullish Harami: Appears during a downtrend, where a small bullish candle follows a large bearish candle. This suggests that selling pressure may be weakening, and a bullish reversal could be imminent.
- Bearish Harami: Appears during an uptrend, where a small bearish candle follows a large bullish candle. It indicates that buying momentum may be fading, and a bearish reversal could follow.
Dark Cloud Cover and Piercing Line
These are two-candle patterns that indicate potential trend reversals.
- Dark Cloud Cover: This bearish reversal pattern forms after an uptrend. The first candle is bullish, followed by a bearish candle that opens above the previous high but closes near the midpoint of the first candle. It signals that sellers are stepping in and could push prices lower.
- Piercing Line: The bullish counterpart of the dark cloud cover, this pattern forms after a downtrend. The first candle is bearish, followed by a bullish candle that opens below the previous low but closes near the midpoint of the first candle. It suggests that buyers are entering the market and a reversal may occur.
The Tweezer Pattern
The Tweezer pattern consists of two candles with matching highs or lows and suggests a reversal in the market. Tweezers can form after an extended trend and often signal a potential turning point.
- Tweezer Top: Appears at the top of an uptrend, where two consecutive candles have identical or nearly identical highs. It indicates that the market has encountered strong resistance, and a bearish reversal is likely.
- Tweezer Bottom: Appears at the bottom of a downtrend, where two consecutive candles have nearly identical lows. It signals that the market has found support, and a bullish reversal may follow.
Common Mistakes in Candlestick Pattern Trading
Despite the effectiveness of candlestick patterns, there are common mistakes that traders often make, especially when they’re first learning to use them. Avoiding these pitfalls can improve your overall trading success.
Over-reliance on Candlestick Patterns
While candlestick patterns can provide valuable insights, relying solely on them without considering the broader market context is risky. Always incorporate other forms of technical analysis and risk management into your strategy. For instance, confirming patterns with trendlines, moving averages, or RSI readings can significantly improve the accuracy of your trades.
Ignoring the Overall Market Trend
A common mistake is trading a reversal pattern in the opposite direction of the prevailing market trend. For example, entering a short position based on a bearish pattern in a strong uptrend can be risky. Even if the pattern suggests a reversal, the overall trend may overpower it. Stick to trading in the direction of the trend whenever possible.
Not Waiting for Confirmation
One of the biggest mistakes traders make is acting on a pattern without waiting for confirmation. Many patterns, especially reversal patterns, require confirmation from the next candlestick or additional technical indicators before entering a trade. Acting too early can lead to premature trades and unnecessary losses.
Neglecting Risk Management
Even if you’re confident in a pattern, proper risk management is crucial. Always use stop-loss orders to limit your risk and never trade without a clear plan for when to exit your position. Additionally, make sure your position size is appropriate for your account size to avoid significant losses.
Conclusion
Candlestick pattern trading is a powerful tool that offers deep insights into market psychology and price action. By mastering key patterns such as the Doji, Hammer, Engulfing, and Morning Star, and combining them with confirmation from other technical indicators and volume, traders can improve their chances of success.
However, no pattern or strategy is foolproof. Trading involves risks, and candlestick patterns should always be part of a broader trading strategy that includes risk management, the use of technical indicators, and an understanding of overall market trends. By staying disciplined, patient, and diligent, you can harness the power of candlestick patterns to make more informed trading decisions and increase your profitability over time.