


DTCC Processes Tokenized US Trades, Targeting October Launch
Digital assets are experiencing a brutal, generational capital rotation out of legacy retail crypto into tokenized institutional infrastructure and AI equities. The cryptocurrency market structure has fundamentally ruptured in July 2026, marking the end of the speculative retail era and the aggressive acceleration of institutional utility. The macroeconomic data presents a stark reality: the digital asset sector has printed its third consecutive quarterly loss, representing the longest sustained bearish sequence since the devastating 2022 winter. This is not a simple risk-off rotation; it is a permanent exit from speculative tokenomics. CoinDesk research confirms the stablecoin market capitalization collapsed to $312 billion in June, the most severe dollar-value contraction since the Terra-Luna implosion. Capital is not sitting on the sidelines waiting to buy the dip; it is exiting the crypto ecosystem entirely, rotating aggressively into AI equities and yielding traditional assets. Simultaneously, the US has demonstrated persistent selling pressure, evidenced by Bitcoin’s Coinbase Premium remaining firmly negative for 50 consecutive days and massive capital outflows from spot Bitcoin ETFs. However, the institutionalization of the backend infrastructure is moving at breakneck speed. The DTCC’s successful tokenization of assets held at the Depository Trust Company on July 15 proves that Wall Street is

Crypto & Digital Assets: The Liquidity Squeeze
Bitcoin Stalls Near $64K Amid Record ETF Outflows Bitcoin is functionally trapped in a distribution phase, trading weakly between $62,500 and $64,460. The asset remains down over 50% from its $126,198 all-time high in October 2025. The bearish catalyst is strictly structural: US spot Bitcoin ETFs just recorded their worst month on record with $4.5 billion in net outflows in June 2026. This mechanical selling pressure by ETF issuers completely overrides any organic retail accumulation. Furthermore, sticky PCE inflation at 4.1% has annihilated any institutional hope for a liquidity-injecting Fed rate cut. The strategic analysis is grim for short-term bulls: Bitcoin is trading as a high-beta tech stock, not an inflation hedge. Until the ETF outflow velocity definitively reverses and stabilizes above the 200-day moving average, BTC represents dead capital. Expect further consolidation with downside risk to $58,000. Mining Sector Capitulation Deepens as Profitability Collapses The structural economics of Bitcoin mining are imploding under current price action. Public infrastructure proxies are suffering massive drawdowns: Riot Platforms (RIOT) faces severe selling pressure, while Marathon Digital (MARA) plunged 6.8%, CleanSpark dropped 6.3%, and Iris Energy (IREN) declined 8.8% in a single session. This is a classic high-beta infrastructure liquidation. With Bitcoin stagnant

Digital Assets & Crypto Infrastructure: The Institutional Convergence
Sovereign regulation and mega-liquidity injections mark the absolute death of the “Wild West” narrative—crypto is now traditional finance. July 15, 2026, marks the absolute point of no return for the institutionalization of digital assets. The days of speculative retail gambling driving market caps are completely over, replaced by sovereign legislative frameworks and relentless corporate infrastructure deployment. The watershed moment occurred today as Japan’s Upper House committee officially cleared the landmark Bitcoin ETF bill. By reclassifying cryptocurrencies as financial instruments under the Financial Instruments and Exchange Act and slashing punitive taxes to a flat 20%, Tokyo has ignited a regulatory arms race in Asia. Spot BTC ETFs on the Tokyo Stock Exchange by 2027 will unlock hundreds of billions in dormant Japanese retail and corporate treasury capital. Consequently, Bitcoin has reclaimed the $64,656 level, operating not as a speculative token, but as a heavily regulated, macro-sensitive digital commodity. Simultaneously, the stablecoin layer is being fundamentally rewired for global enterprise routing. Cyclops’ $20 million Series A, backed by heavyweights like Coinbase Ventures and Circle, proves that venture capital is entirely abandoning native token speculation in favor of boring, hyper-scalable settlement rails. We are witnessing a massive structural decoupling: utility-driven infrastructure and sovereign-approved
The Institutional Supply Shock: Bitcoin’s Transition to Synthetic Reserve
Spot ETFs haven’t just provided retail access; they’ve triggered a permanent, high-velocity supply shock that legacy finance is vastly underpricing. Bitcoin has officially completed its metamorphosis from a speculative tech proxy to a mature, non-correlated synthetic reserve asset. After an explosive Q1 where BTC surged past the $73,000 threshold, the current consolidation in the $54,000 to $64,000 range is textbook institutional absorption. The underlying market mechanics are unprecedented. We are witnessing billions in sustained, programmatic inflows from US spot ETFs, fundamentally overriding the traditional four-year halving cycle narrative. This isn’t retail FOMO; this is sovereign wealth funds, pension accounts, and Wall Street giants quietly accumulating the absolute scarcest monetary asset on the planet. Furthermore, the recent volatility and capital rotation within the digital asset ecosystem is completely misunderstood by traditional analysts. Capital isn’t exiting the blockchain; it’s aggressively rotating into high-beta risk assets, decentralized finance (DeFi) primitives, and real-world asset (RWA) tokenization infrastructure. At the same time, Ethereum’s market dominance is cementing its monopoly as the permissionless, Turing-complete settlement layer for the emerging AI economy. Strategic Conclusion: The risk-reward asymmetry for Bitcoin is currently the best in modern financial history. Stop trading the daily volatility and start managing your long-term

BTC/USDT Daily Analysis: Key Technicals & ETF Flows
Discover the latest March 2026 Bitcoin diagnostic. We break down macro headwinds, on-chain data, and market mechanics to reveal why protecting capital is your best move right now.

ETH/USDT Daily Technical Outlook & On-Chain Fundamentals
Ethereum is sitting on a historic make-or-break trendline. Discover why macro headwinds, locked on-chain supply, and peak retail apathy are creating a massive contrarian setup for ETH.

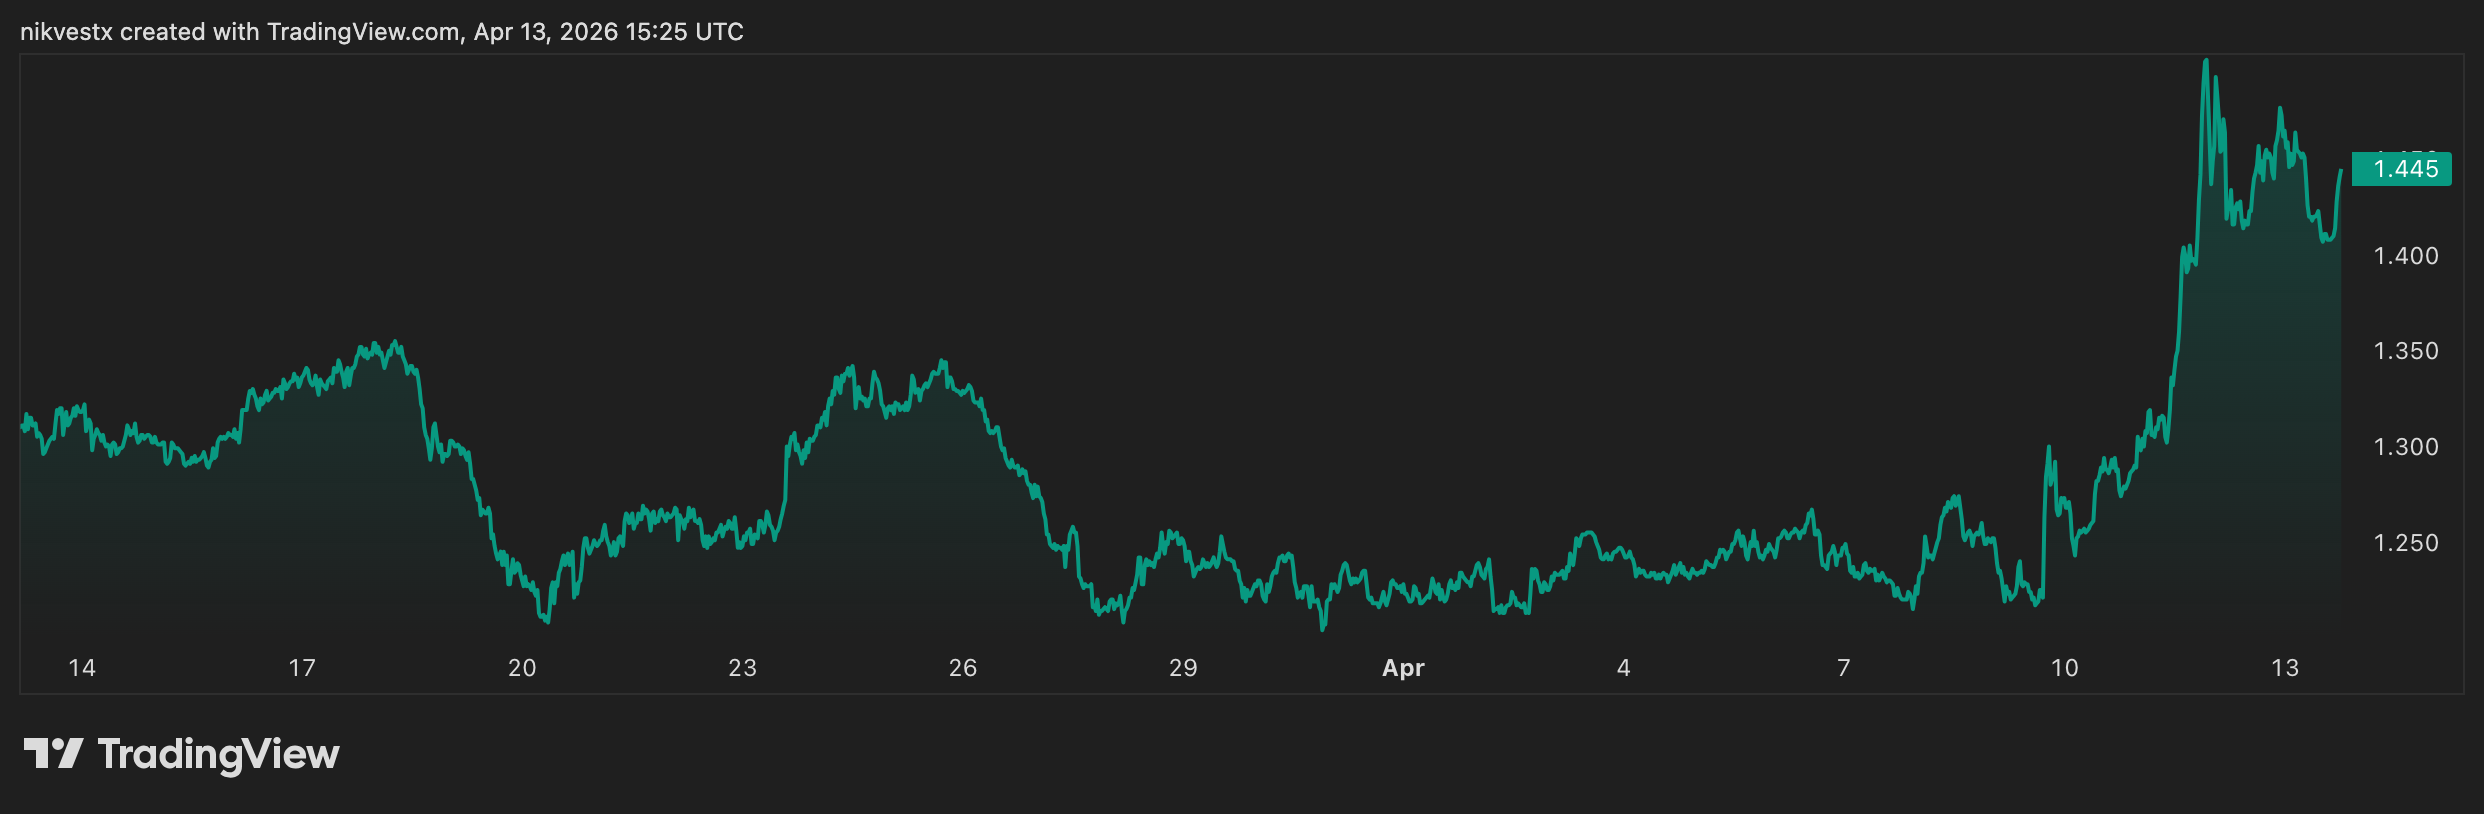
XRP/USDT Daily Analysis: Chart Setups & Legal Drivers
Ripple is currently trading in a tight, low-volatility zone between $1.34 and $1.37. If you look solely at the charts, it looks like a complete standstill. But beneath that boring price action, an incredible divergence is playing out between retail fatigue and massive institutional groundwork.

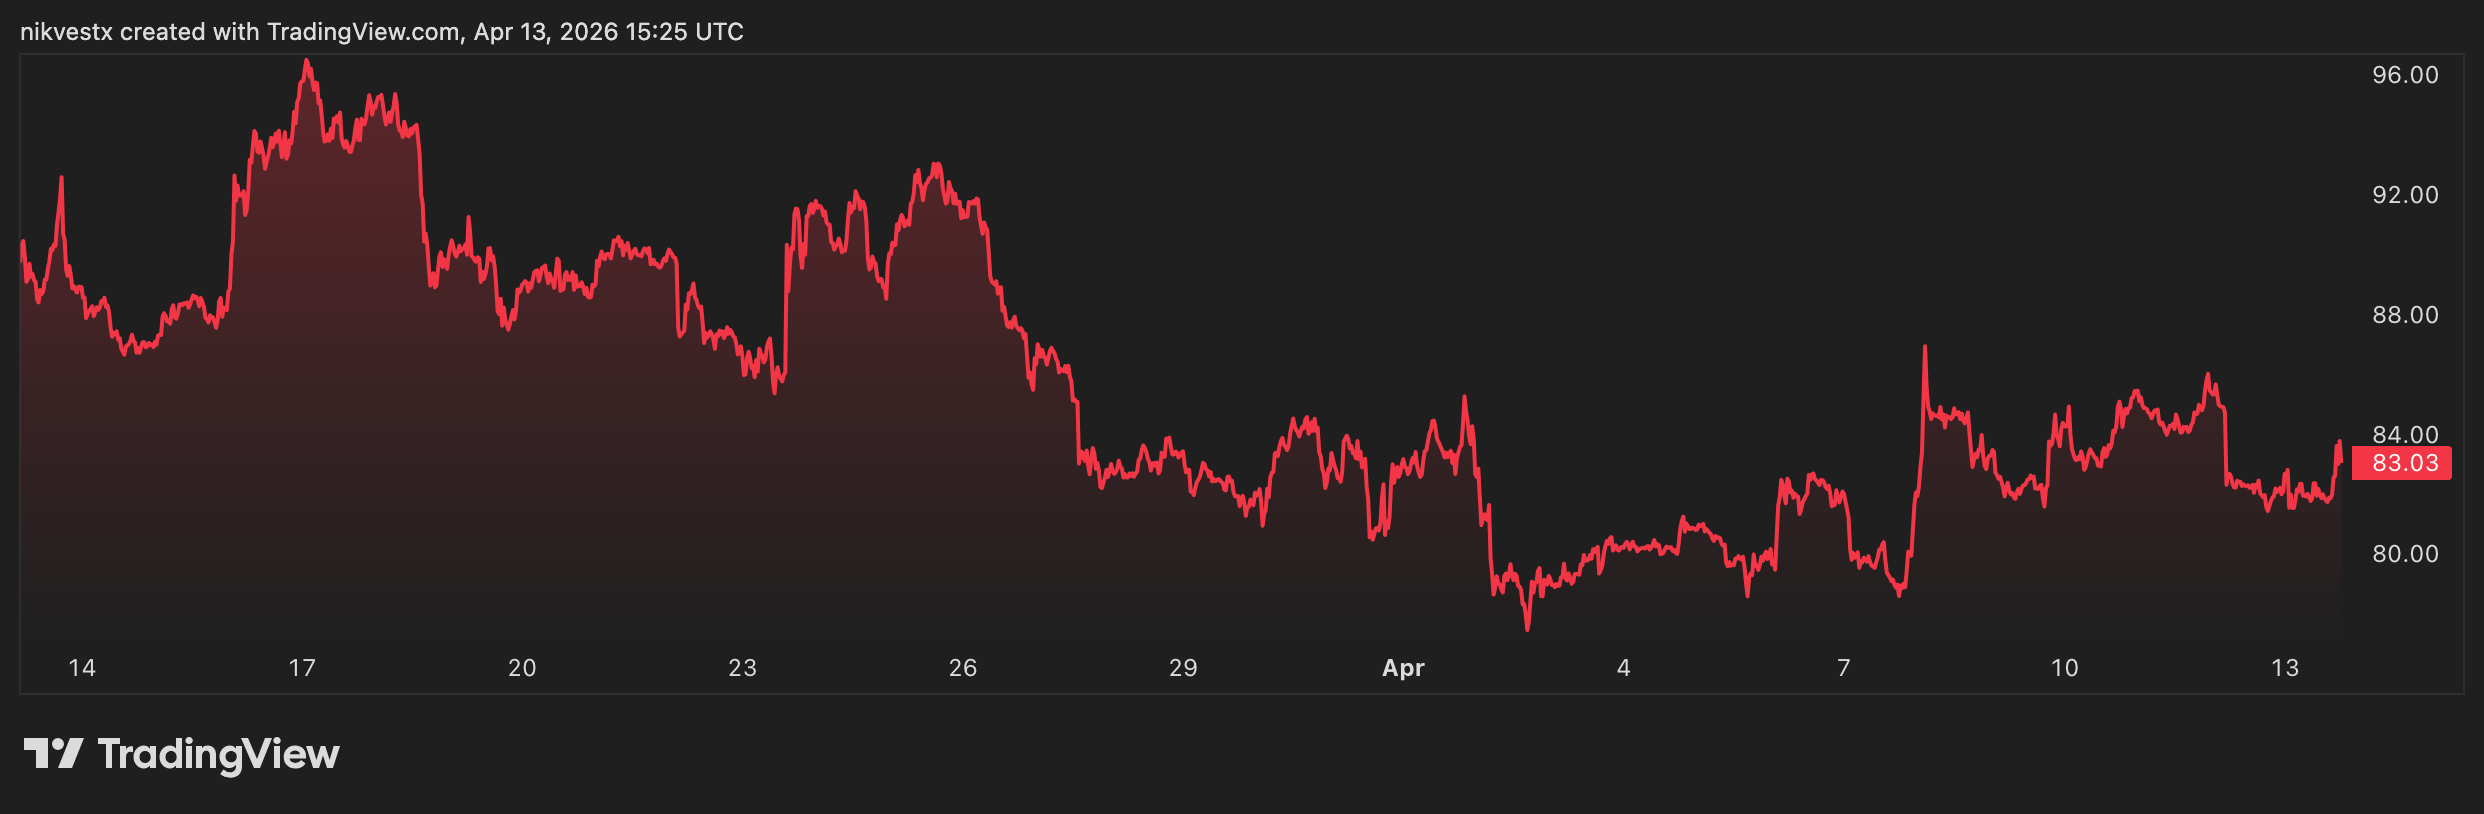
SOL/USDT Daily Market Forecast & Chart Analysis
Solana is currently trading in the $83.50 to $85.00 range. If you are watching the charts right now, you are likely seeing a severe disconnect between the asset’s dropping price and its exploding fundamental value.

ADA/USDT Daily Analysis: Cardano Fundamentals & Price
Crypto Daily Analysis Top 2026 Crypto Trading Strategies Ethereum Analysis 2026 Ripple Analysis 2026 Ripple Analysis 2026 Bitcoin Analysis 2026

BNB/USD Daily Technical Analysis & Ecosystem Updates
BNB: Binance’s Unstoppable Engine 📅 Oct 1, 2025 📈 Price & Performance: Picture this: On October 1, 2025, BNB is cruising at $1,022.28 USD, up a cheeky 0.92% in the last 24 hours—like it’s casually flexing after a solid workout. With a market cap of $142.38 billion and $3.11 billion in daily volume, it’s the fifth-largest crypto by cap, showing real muscle in liquidity. Circulating supply sits at 139.18 million tokens, down from its all-time high of $1,080.48 just 10 days ago— a mere 5.32% dip, but that’s pocket change in crypto’s wild ride. Over the past month, BNB’s climbed from sub-$900 levels, fueled by Binance ecosystem perks like fee discounts. Pro tip: Track volume spikes; they’re your early whisper for momentum shifts, turning data into dollars. 📊 Technical Analysis: BNB’s chart is whispering “bullish breakout” in a rising medium-term trend channel, where buyers keep lifting the floor higher—classic sign of sustained investor hunger. On the four-hour view, the 50-day EMA is dipping slightly for a breather, but the 200-day beast is roaring upward since late September, screaming long-term strength. RSI hovers neutral at 34-40, dodging overbought traps, while MACD shows converging lines hinting at a crossover pop. Key support

TRX/USDT Daily Forecast: Tron Network Trends & Charts
TRON’s Quantum Leap: Blockchain’s Underdog Champion 📅 Oct 1, 2025 📈 Price & Performance: TRON (TRX) is trading at $0.3383 today, October 1, 2025, marking a modest 0.48% uptick over the last 24 hours amid broader market jitters. With a market cap of $32.03 billion and 24-hour volume hitting $753.93 million, it’s showing solid liquidity—volume-to-cap ratio at 2.35% signals healthy trader interest without overheated frenzy. Circulating supply stands at 94.66 billion tokens, far from its infinite max, keeping inflation in check. Year-to-date, TRX has clawed back from its December 2024 all-time high of $0.4407 (down 23.22%), but it’s a staggering 30,907% above its 2017 lows. Pro tip: Track volume spikes as a leading indicator—when they outpace price, it often precedes breakouts, helping you time entries like a pro. This resilience underscores TRON’s evolution from meme coin vibes to a DeFi powerhouse, rewarding patient holders with steady compounding gains. 📊 Technical Analysis: Diving into the charts, TRX paints a bullish canvas with its 50-day moving average firmly above the 200-day, confirming an uptrend that’s held since March 2025. RSI hovers neutrally at 52.37, avoiding overbought traps while room for upside glows—no panic sells in sight. MACD lines are crossing bullishly, with

DOGE/USDT Daily Price Analysis & Fundamental Movers
– – Meme Monarch: DOGE Rules the Crypto Jungle 📅 Oct 1, 2025 📈 Price & Performance: Dogecoin’s trading at $0.2424 USD today, a solid 5.21% jump over the last 24 hours, flipping the script on yesterday’s dip. Volume’s roaring at $2.6 billion, signaling fresh trader frenzy, while market cap hits $36.64 billion—still the top dog in memes. Zoom out: it’s up 79% year-to-date, but that 24-hour low of $0.2268 shows volatility’s bite. Whales scooped 21 million DOGE amid the pullback, hinting at smart money bets. Pro tip: Track the 50-day EMA ($0.23) for entry cues—it’s your crystal ball for sustained rallies. This pup’s got legs, but watch for profit-taking shadows. 📊 Technical Analysis: Picture this: DOGE’s hugging the 100-day EMA at $0.2263 like a loyal sidekick, with the 20-day at $0.246 acting as that pesky ex—resistance we can’t quite shake. RSI’s chilling at 43.1, not screaming oversold but whispering “room to run” if it climbs past 50. MACD’s bearish crossover lingers, yet Bollinger Bands are squeezing tight, priming for a volatility pop. Daily charts flash a “Buy” on moving averages, but weekly’s neutral with a Fear & Greed at 50. Technique hack: Layer Fibonacci retracements from the $0.20 low—0.618

Operational Vaporization and the Hyperscaler Liquidity Trap: Q3 2026 Structuring
The 14% headcount reduction at Coinbase is not a distressed beta signal. It is an algorithmic margin execution. If you are shorting COIN at current valuations because you think 660 humans leaving a building signals “operational weakness” in a 24/7 matching engine, you are the patsy. You are fundamentally mispricing the velocity of middle-office vaporization. The mainstream narrative assumes headcount correlates with throughput. It does not. Technology now executes what those 660 humans used to process at 3.4x speed with zero error-rate decay. You are shorting a 15-20% structural margin expansion because you read a Bloomberg headline about layoffs. You are funding the firm’s R&D. The Thermal Dynamics of the $81k BTC Absorption Look at the underlying order book routing, not the CoinDesk 20 Index ticker. BTC tapping $81,134.75 triggered a localized thermal vent of $207.56 million in net realized profits. The retail consensus assumes this is a cycle top. They see the profit-taking, assume exhaustion, and dump their spot bags into the rip. They are mathematically illiterate. When $207M of localized supply hits the tape and the price holds, that is not a distribution pattern. That is a structural absorption node. Institutional desks are running aggressive TWAP icebergs to
Solana (SOL) Price Forecast: High-Beta Capitulation
Solana is the ultimate double-edged sword. When global liquidity flows, it flies; when the liquidity drains, the gravity is merciless. Signal: WAIT (Spot Accumulation Only) | Expiration: May 1, 2026 Entry: $68.00 – $75.00 TP1: $100.00 TP2: $120.00 SL: $62.00 SOL 5 Major Levels: $140.00 (Resistance – Macro Supply Zone) $100.00 (Resistance – The Concrete Ceiling) $79.78 (Current Active Price) $67.50 (Support – The Genesis Capitulation Wick) $50.00 (Target – Deep Historic Base) Description, Probabilities & Price Prediction: Solana acts as a leveraged beta play. During euphoric phases, it absorbed massive retail volume driven by memecoin speculation. With the global risk-off pivot, that speculative capital has completely evaporated. The chart reveals a textbook algorithmic capitulation sequence. The asset sliced through the $100 psychological floor and wicked perfectly into the deep liquidity pool at $67.50 to clear out retail stop-losses before bouncing. The volatility has now completely died. Probabilities: 65% probability of a prolonged, violent sideways chop as the asset transitions into macro accumulation; 25% chance of an artificial algorithmic pump. Price Prediction: Do not use margin here; theta decay will destroy your account. Expect the asset to grind sideways in a brutal apathy channel between $70.00 and $90.00. Spot accumulation
Toncoin (TON) Forecast: The Telegram Trench & Macro Drag
TON is desperately attempting to decouple from the crypto bear market via Telegram’s user base, but gravity eventually catches everyone. Signal: SHORT | Expiration: April 22, 2026 Entry: $4.90 – $5.10 TP1: $4.50 TP2: $3.20 SL: $5.70 TON 5 Major Levels: $7.50 (Resistance – All-Time High) $6.20 (Resistance – Structural Pivot) $4.95 (Current Active Price) $4.50 (Support – Critical Near-Term Floor) $3.20 (Target – Institutional Order Block) Description, Probabilities & Price Prediction: Toncoin has displayed remarkable relative strength, buffered by the narrative of seamlessly onboarding Telegram’s massive user base into Web3. However, relative strength in a prolonged bear market usually means you are just the last asset to fall. The aggressive spot buying that drove the token past $7.00 has completely exhausted itself, printing a sequence of lower highs. The asset is leaning heavily on the $4.50 support floor. Probabilities: 65% probability that TON succumbs to macro drag and shatters the $4.50 support; 35% probability of a resilient defense. Price Prediction: The delayed capitulation is arriving. Expect the $4.50 support to crack, sending the asset spiraling down to the $3.20 institutional accumulation zone where true venture bids reside. 🔘 Also Read: Dogecoin Trading Guide: Profiting from the Original Memecoin 🔘


