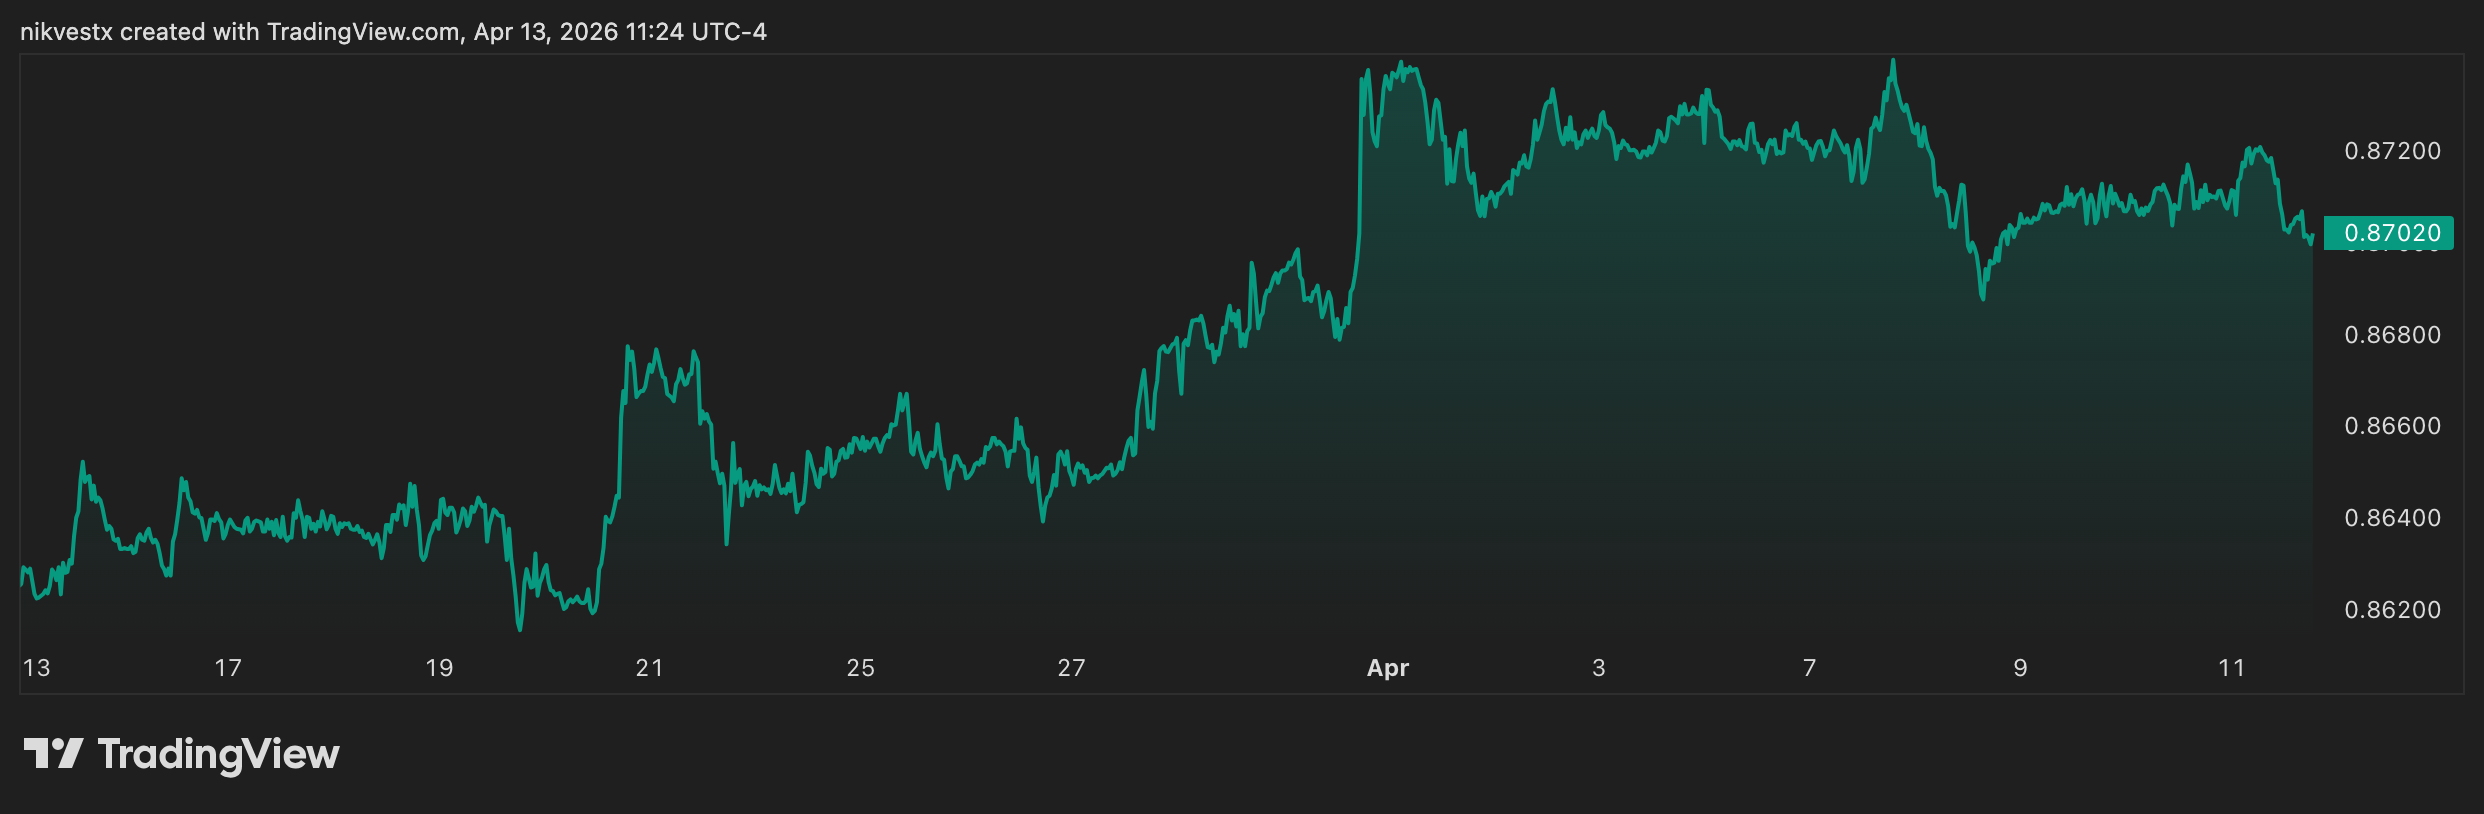
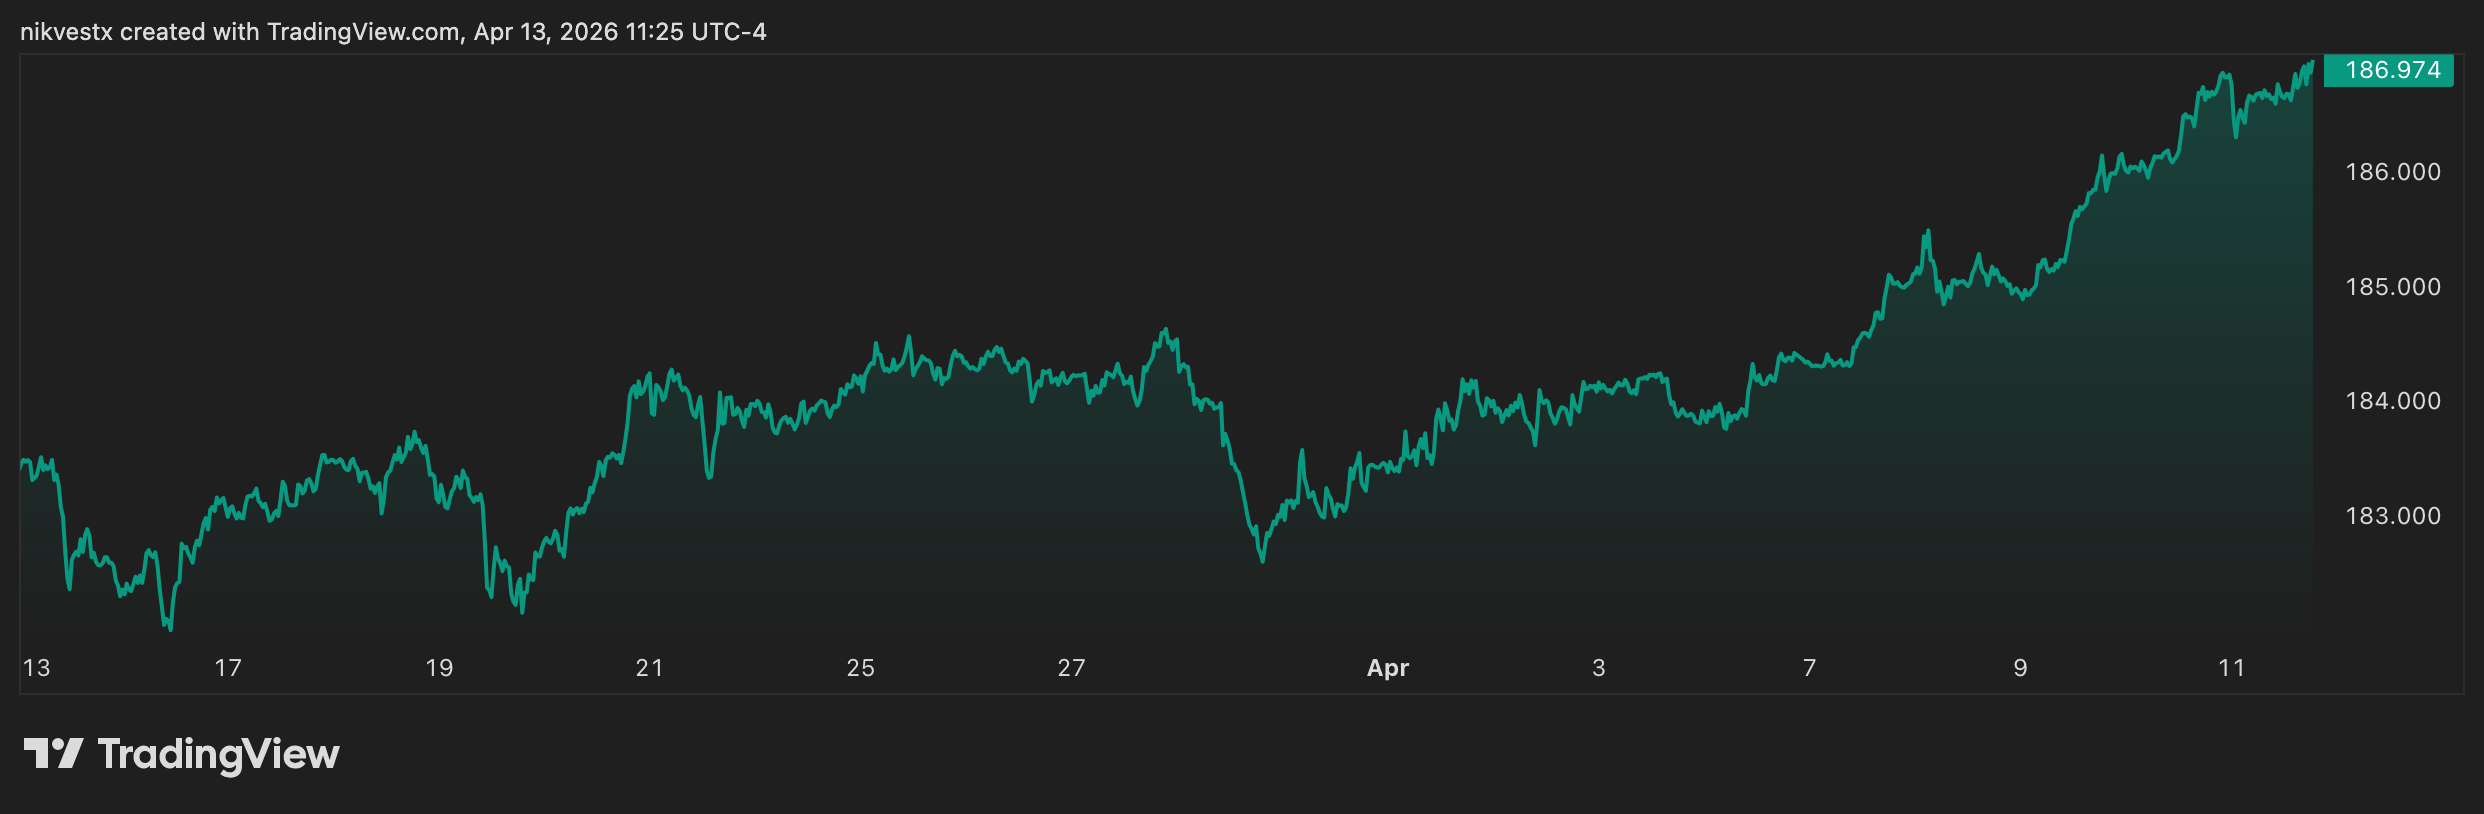
Alright, let’s cut the fluff. You’re looking at EUR/USD heading into the back end of 2026 and through 2027. Here’s the practical breakdown using the metrics that actually move this pair — no indicator salad, just what matters.
What’s Driving It Right Now
Interest rates & central bank policy are still the boss. The Fed has been cautious about cutting too fast because inflation (especially core) has been sticky in the 2.4–2.6% zone. The ECB has been a bit more comfortable with lower rates as eurozone growth has been softer. That rate differential has kept a soft bid under the dollar for months, but it’s not as extreme as it was in 2024–2025.
Inflation (CPI/Core) remains the key data point. Every time US CPI comes in hotter than expected, EUR/USD gets punched lower. When eurozone inflation undershoots, it does the same. The market is still hypersensitive to anything that changes the rate path.
Employment & growth — NFP has been mixed. Strong prints still give the dollar a boost, but the labor market isn’t overheating the way it was a couple of years ago. Eurozone PMI numbers have been hovering around the 50 line — not collapsing, but not inspiring either. GDP growth differentials still favor the US, though the gap has narrowed.
Trade balance & current account — The eurozone still runs a decent surplus, which provides a slow underlying bid for the euro. It’s not flashy, but it matters over multi-month horizons.
Technical Picture (What the Chart Is Saying)
Market structure on the daily and weekly is still range-bound to mildly bearish. We’re seeing lower highs on the weekly since the summer peaks. The 200-day EMA has been acting as dynamic resistance on several tests, and price is currently living mostly below the 50-day EMA.
RSI has been oscillating between 40–60 for weeks — classic indecision. MACD is flat and hugging the zero line. ATR has compressed, which usually means a bigger move is building. Bollinger Bands are tightening. When they finally expand, it often marks the next directional leg.
Key levels people are watching:
- Resistance cluster around 1.0950–1.1050 (previous swing highs + 200 EMA zone)
- Support around 1.0650–1.0700, then the bigger 1.0500 psychological area
Fibonacci retracement of the big 2025–2026 rally shows the 61.8% level sitting near some of that support. ADX is low (under 20), confirming the lack of strong trend.
Q4 2026 Outlook
Expect more chop until one of two things happens: either US inflation cools enough that the Fed signals clearer cuts into 2027, or eurozone data (especially PMIs and GDP) surprises to the upside and the ECB turns less dovish.
My base case for the rest of Q4 is continued range trading between roughly 1.06 and 1.10, with spikes around high-impact data (NFP, CPI, FOMC, ECB). Volatility will likely stay elevated around those releases — ATR on the daily has been in the 70–90 pip range recently, so size accordingly.
Looking into 2027
This is where it gets interesting. If the Fed cuts more aggressively than the ECB in 2027 (which is the current market pricing leaning), the rate differential should narrow further and support a gradual recovery in EUR/USD. A move back toward 1.12–1.15 isn’t crazy if US growth slows and eurozone data stabilizes.
The risk to that view is sticky US inflation forcing the Fed to stay higher for longer, or a geopolitical shock that sends money into the dollar as a safe haven. Also watch any major shift in eurozone fiscal policy or energy prices — those still matter for the euro.
Practical takeaway:
- Trade the range until structure breaks (clear higher highs or lower lows on the daily/weekly).
- Use ATR for stops and position sizing — don’t force the same size in low vs high volatility.
- Risk 0.5–1% per trade max. The edge here is in patience, not in forcing trades in the middle of the range.
- The biggest edge will come from correctly reading the rate path divergence between the Fed and ECB.