


The QM pattern might be a familiar concept for those involved in Forex trading. Recognized for its predictive power regarding market trends, this pattern is a crucial strategy based on price movement, aiding traders in identifying potential market reversal points.
Analyzing the QM Pattern in Forex Trading
The QM pattern is uniquely characterized by its typical formation, which consists of three peaks or troughs in the shape of an “M” or” “”” t “a “i” g charts. This distinct formation makes it easily identifiable and a useful tool that traders can seamlessly incorporate into their strategies.
Bullish and Bearish Versions of the QM Pattern
Understanding the bullish and bearish versions of the QM pattern is crucial for effective application:
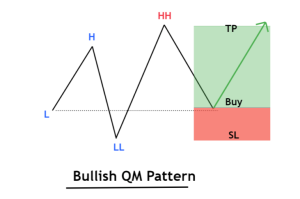
- Bullish QM Pattern: This pattern appears as a low, followed by a higher low and a higher peak. It indicates a potential upward trend and can signal traders to look for buying opportunities.
- Bearish QM Pattern: Conversely, the bearish pattern features a higher peak, followed by a lower peak, and finally, a lower low. This suggests a potential downward trend, signaling traders to consider selling opportunities.
Recognizing these changes is fundamental for traders forecasting market trends and making informed trading decisions.
The QM Pattern as a Candlestick Formation
In addition to its unique shape, the QM pattern is also a candlestick pattern. It is formed by a series of candlesticks on the chart, which provides insights into market sentiment and potential price movements. Understanding the characteristics of these candlesticks helps traders gain insights into market behavior and potential price actions.
Mastering the QM Pattern for Profitable Trading
To leverage the QM pattern effectively in Forex trading for profitable outcomes, consider the following strategies:
- Identify Key Support and Resistance Levels: To gauge potential price movements, recognize significant support and resistance levels within the QM pattern.
- Track Trend Lines: Follow trend lines to understand the market direction and adjust trading strategies accordingly.
- Interpret Price Movement Signals: Analyze price movement signals within the QM pattern to anticipate market trends and make informed trading decisions.
- Implement Risk Management Strategies: Utilize risk management techniques to protect against potential losses and maximize gains.
- Set Profit Targets: Establish clear profit targets to ensure that trades are aligned with market conditions and trading goals.
Mastering the QM pattern involves recognizing technical indicators, studying successful trade examples, and applying effective risk management strategies. By integrating these practices, traders can enhance their ability to predict market trends and achieve profitable outcomes.
The QM Pattern:
The QM pattern is a new chart pattern in the market that traders use to identify potential trading opportunities within market structures. However, one of the common challenges when trading with this pattern is dealing with false breakouts. This occurs when the market seems to break through a support or resistance level but quickly reverses direction.
To avoid this issue, it is essential to thoroughly analyze price movement signals and other technical indicators before executing any trades. The QM pattern is known for its high potential to signal the end of an uptrend and the beginning of a potentially down-trending market.
Difference Between QM Pattern and Head and Shoulders Pattern:
Traders who pay attention to market movements can use the Casimodo chart pattern to identify uptrends and downtrends. Additionally, this pattern can be used to identify the Head and Shoulders pattern, which is a Casimodo downtrend pattern that may signal the end of an uptrend.
Both the Casimodo reversal pattern and the Head and Shoulders pattern are known for indicating trend reversals in trading. However, their formations, entry points, and risk-to-reward ratios differ significantly.
Key Differences:
- Formation and Psychology of the Patterns:
While the underlying goals of both patterns—the battle between buyers and sellers leading to a potential trend reversal—are similar, their formations are different.- Head and Shoulders: Characterized by two shoulders (left and right) and ahead. The left and right shoulders typically have bottoms that are equal or nearly equal.
- QM Reversal Pattern: In this pattern, the bottom on the right side of the chart is significantly lower than the bottom on the left side, creating a more asymmetrical appearance compared to the Head and Shoulders pattern.
- Entry Points:
- Head and Shoulders: The typical entry point for trading this pattern is around the neckline, which is formed by drawing a line connecting the bottoms of the two shoulders.
- In a bearish Head and Shoulders pattern, traders usually wait for the price to break below the neckline after forming the right shoulder before initiating a trade.
- In an inverse Head and Shoulders, the common approach is to enter the market not at the second shoulder but after the price breaks above the neckline.
- QM Reversal Pattern: The entry point for shorting in the Casimodo pattern is usually around the peak of the lower bottom, which differs from the standard neckline entry point in the Head and Shoulders pattern. In bearish QM trading, the strategy often involves selling at the right shoulder.
- The entry point for an inverse QM pattern can be at the third trough (right shoulder).
- Head and Shoulders: The typical entry point for trading this pattern is around the neckline, which is formed by drawing a line connecting the bottoms of the two shoulders.
- Risk-to-Reward Ratios:
Differences in formations and entry points between these two patterns also lead to variations in risk-to-reward ratios, which are crucial for traders in strategic decision-making. - Stop Loss and Take Profit Levels:
- Bearish Head and Shoulders: The take profit target is usually set at a distance equal to the distance between the head and the neckline. The stop loss level can be set slightly above the third peak or adjusted based on the risk/reward ratio.
- Inverse Head and Shoulders: Similarly, the take profit target is set at a distance from the head to the neckline. The stop loss level can be set slightly below the third trough, again considering the risk/reward ratio.
In summary, while both the inverse QM pattern and the Head and Shoulders pattern indicate potential trend reversals, they require different approaches to identifying entry points and managing risks. Understanding these nuances is crucial for traders to incorporate these patterns effectively into their trading strategies.
Understanding Bearish and Bullish QM Patterns in Forex Trading
- Bearish Quasimodo Pattern:
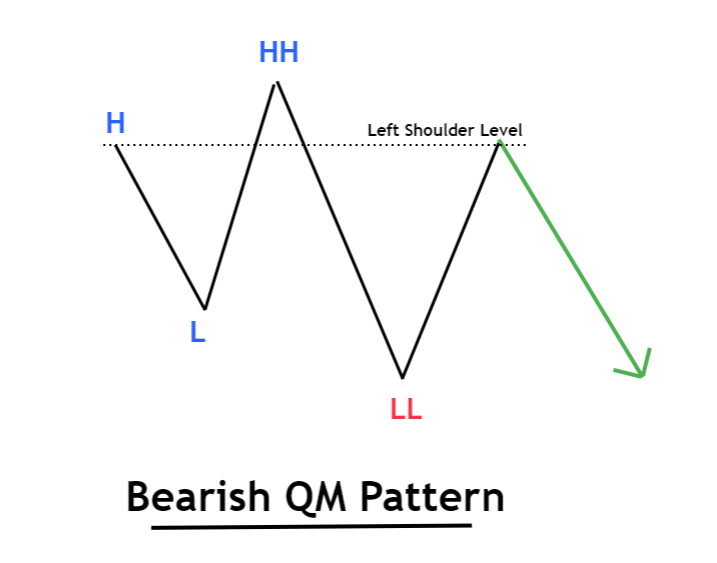
In the Forex trading world, the bearish QM pattern appears at the end of an uptrend and signals the beginning of a new downtrend. This formation includes three peaks (a head in the middle with two shoulders on the sides) and two troughs. Notably, the second peak (head) is the highest point, and the second trough is the lowest point.- Formation of HH and LL.
- The most recent high price acts as the level of the left shoulder.
- After a lower trough, the price returns upwards to the level of the left shoulder and will then continue the downtrend.
- Bullish QM Pattern:
Conversely, the bullish Casimodo (inverse) pattern indicates the end of a downtrend and suggests the possibility of an uptrend. This pattern includes three low points (with a head in the center and two shoulders on either side) and two high points, where the second trough (head) is the lowest and the second peak is the highest.
To identify the bullish Quasimodo pattern, follow these guidelines:- Formation of HH and LL.
- The most recent low price acts as the level of the left shoulder.
- After a higher peak, the price returns to the level of the left shoulder and then continues the uptrend.

- Forex Trading Strategy for the QM Pattern:
- Selling (Short):
The strategy suggests that a trader should open a short position immediately after forming the higher trough (second shoulder) in the bearish Casimodo pattern. The trough between the head and the right shoulder can be considered a profit target, while the head serves as a stop-loss target. - Buying (Long):
According to the bullish Casimodo pattern rules, a long position can be considered immediately after the appearance of the second shoulder. The higher trough (second shoulder) can be seen as a potential entry point. It is recommended to set the take-profit order at the peak between the head and the right shoulder and use the head as a stop-loss target.
- Selling (Short):
Dealing with Non-Ideal Pattern Formations:
While theories are often based on ideal conditions, real market scenarios can differ. For instance, if the profit target is significantly smaller than the stop-loss level, standard rules may not be applicable.
In such scenarios, adjusting the stop-loss order or increasing the profit target might be necessary, depending on market conditions and signals from other reliable indicators. For example, increasing the profit target is recommended if there are strong signs of a trend reversal or shortening the stop-loss distance in cases of low trading volumes.
QM Trading Strategy for Identifying Entry Points:
The QM pattern trading strategy is a distinctive approach that effectively identifies potential buy and sell areas. It is particularly profitable for trading major currencies and cryptocurrencies.
In the world of cryptocurrency trading, the diversity of strategies for generating profit is significant. There are various paths to reach a single destination—some faster, some slower, some riskier, and others less risky. The ultimate goal for traders is profit, and there are various ways to achieve this goal.
Understanding the Casimodo Trading Strategy:
The QM trading strategy is characterized by patterns of highs and lows, which are commonly used to identify trend reversals. This pattern bears similarities to the Head and Shoulders pattern, including its inverse form. The name “C’simod” is derived from a cartoon character with a hunched back, reflecting the shape of this trading pattern.
Initially, the Casimodo strategy was mainly used to identify trend reversals. However, recent developments have revealed more variations of this strategy that are also applicable to continuation entries. This has led to the division of the Casimodo strategy into two main types:
- Casimodo Reversal Pattern (QMR):
This type focuses on identifying points where the trend is likely to change and is particularly useful for identifying the end of uptrends or downtrends and signaling the start of the opposite trend.
The QM reversal pattern (QMR) is a significant trading pattern that occurs at the peak of a long trend, which can be either bullish or bearish. This pattern is especially notable in cryptocurrency trading.
- Bearish Reversal Pattern:
- The bearish QM pattern forms after a period of bullish momentum or a price rally in cryptocurrencies. It is characterized by a sequence of higher peaks and higher troughs.
- This pattern appears when buyers start to lose momentum, forming a higher peak followed by a lower trough instead of a higher trough. This lower trough indicates that buyers might have failed in the price battle.
- Subsequently, a lower peak forms, usually around the same level as the first higher peak but lower than the second higher peak. This formation indicates a potential shift in market control from buyers to sellers.
- Bullish Reversal Pattern:
- In contrast, the bullish Casimodo reversal pattern forms after a long downtrend and is typically visible at the bottom of the trend. This pattern is the exact opposite of the bearish reversal pattern.
Trading the QM Reversal Pattern:
- Pattern Identification and Confirmation:
- The QMR pattern can be identified in any time frame. After identifying the pattern, traders often confirm their entry with reversal signals on another time frame, such as engulfing candlestick patterns or morning and evening stars.
- The trade involves identifying the entry point, setting the stop-loss (SL) level, and determining the take-profit (TP) levels.
- The stop-loss level is usually placed slightly above the highest peak (the ‘head’ “of the pattern), while the entry point is around the area of the first higher peak, which becomes the new lower peak after failing to form a higher peak.
- Using multiple take-profit levels is common to avoid early or late exits. The first take-profit level might be set near the higher peak before a price rally, while the second take-profit level can be set at the higher trough at the beginning of the rally.
- Advantages of the QM Reversal Pattern:
- This pattern is known for its efficiency, with a high likelihood of a reversal occurring when identified.
- It offers traders a high risk-to-reward ratio, leading to more profitable trades and fewer losses.
- The distinct shape of the Casimodo pattern makes it easier to identify, especially when the chart is converted to a line chart.
- It provides an opportunity for earlier entry compared to other chart patterns like Head and Shoulders, where traders must wait for the neckline to be broken.
- Disadvantages of the QM Reversal Pattern:
- Implementing the QMR strategy manually can be challenging, and coding it into trading algorithms can be difficult.
- Trading based on trend reversals inherently carries risks. Market participants can manipulate such patterns to their advantage, which may lead to losses for retail traders, especially when prominent entry points like those in the QMR pattern are involved.
- While the Casimodo reversal pattern offers an attractive opportunity for traders, especially in the cryptocurrency market, it requires careful analysis and consideration of market dynamics to leverage its potential effectively.
QM Continuation Pattern (QMC):
- Pattern Definition and Use:
- As the name suggests, this type finds continuation entries within an existing trend. It helps traders join the trend at optimal points, increasing the likelihood of profitable trades.
- The QMC pattern is a type of QM pattern that forms during the continuation of a trend. The QM shape can also be observed at trend continuation points. It usually occurs immediately after a reversal.
- When the market reverses and another Casimodo pattern forms, traders have a second chance to capitalize on the trend movement. Its shape is exactly like the standard Casimodo pattern, but it continues the trend.
Trading the Casimodo Continuation Pattern (QMC):
- Pattern Definition and Entry Points:
- The QMC pattern is traded similarly to the QMR pattern. For a bullish continuation pattern, the entry point is typically set around the level of the first lower trough or what appears to be the shoulder level of the pattern. The stop-loss level is placed slightly below the last lower swing or what seems to be the head of the pattern. The take-profit level can be set approximately at the beginning of the previous downtrend.
- Opportunities with the QMC Pattern:
- The QMC pattern provides traders with an additional opportunity to increase their long positions or continue following the trend based on pattern confirmation. This continuation pattern, identifiable by its distinct Casimodo shape, is significant in helping traders make informed decisions in trend-following strategies, particularly in markets with clear and stable trends.
- Application in Cryptocurrency Markets:
- In the dynamic and volatile world of cryptocurrencies, the QM pattern strategy offers a novel and profitable way to navigate the market. Its adaptability to varying market conditions and trends makes it a valuable tool for traders seeking to maximize their gains in the crypto space. Whether for reversal or continuation trades, the QM pattern is recognized as a powerful tool for achieving trading success.
Identifying the QM Pattern and Entry Points:
- Effective Confirmation of QM Signals:
- Using reliable technical analysis tools and methods is crucial for confirming QM pattern signals in trading. While useful, patterns require confirmation through various indicators and tools that predict trend reversals.
- Popular Indicators for Confirming QM Signals:
- Relative Strength Index (RSI): Useful for indicating trend reversals, especially through divergence.
- Moving Average Convergence Divergence (MACD): Effective for identifying trend reversals, particularly with divergence.
- Simple Moving Average (SMA): Typically used to confirm trend reversals, with varying period settings based on the trading time frame.
- Divergence Methods:
- Regular Divergence: Provides more reliable signals and is preferred for confirming trades.
- Bullish Regular Divergence: Occurs when the indicator forms higher peaks while the price decreases, signaling a buying opportunity.
- Bearish Regular Divergence: Occurs when the indicator forms lower peaks while the price increases, signaling a selling opportunity.
- Using Moving Averages:
- Employ two moving averages with different periods (e.g., 50, 100, and 200 for longer time frames and 9, 12, and 21 for shorter periods).
- A golden cross, where the shorter-period MA crosses above the longer-period MA, indicates an upward movement.
Tips for Trading the QM Pattern in Forex:
- Wait for the Complete Formation: Avoid entering trades until the QM pattern is fully formed.
- Optimal Time Frames: Medium and long-term time frames are generally more effective for setting the Casimodo pattern.
- Trend Strength: Identify strong trends, as stronger trends typically provide more reliable signals.
- Stop-Loss Levels: Set stop-loss levels based on the specific QM pattern and use a risk/reward ratio of 1:2, 1:3, or higher.
- Distinguish Between Patterns: Be careful not to confuse bearish and bullish QM patterns or mistake the Casimodo pattern for the Head and Shoulders pattern.
Effective confirmation of QM signals involves a combination of divergence methods, moving average analysis, and careful observation of trend strength and pattern formation. Proper confirmation of these signals is crucial for making informed trading decisions and managing risk effectively.
What is the Left Shoulder Level?
In technical analysis, historical swing levels always act as significant strong levels. A swing level is created from a swing point, and a key level is generated from multiple swing points.
The left shoulder is a key level that can influence the direction of the price trend. A trend reversal might occur after forming a lower or higher point, but you should wait for the best price level. The left shoulder often represents this optimal price level.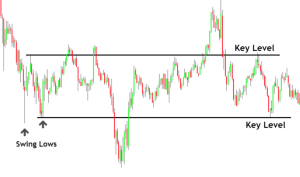
QM Pattern – Best Position in the Chart
The position of the pattern on the chart in technical analysis is crucial. It helps distinguish between high-quality trades and less reliable ones.
- Bullish Pattern: Should form in a support area or demand zone.
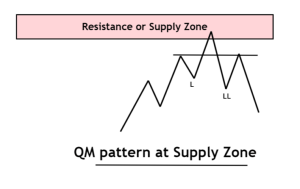
- Bearish Pattern: Should form in a resistance area or supply zone.
- Avoid Trading in Unfavorable Market Conditions: The pattern should not be traded under different market conditions.

QM Pattern – Buy Signal
In a bullish QM pattern, highlight the left shoulder level after forming a higher peak by adding a horizontal line or area at the second-to-last lowest low made by the price. Place a limit buy order at the left shoulder level and wait for the price to fill the order.
- Stop-Loss: Place it below the last lowest low.
- Take-Profit: The top of the QM pattern serves as a profit target.

QM Pattern – Sell Signal
After forming a lower low in a bearish QM pattern, draw a horizontal line at the left shoulder level or the second-to-last highest high. Place a limit sell order at this left shoulder level and wait for the price to complete the order.
- Stop-Loss: Place it above the last highest high.
- Take-Profit: The bottom of the QM pattern serves as a profit target.
The QM pattern is an advanced form of price action, and professional traders use it to predict market movements. While there are many QM signals on the chart, few will be winning signals. The probability of winning can be enhanced by incorporating other technical tools like FTR (Failure to Return), flag limits, compression, and Fibonacci.
Start by mastering a simple QM pattern, and then progressively build towards creating the best trading strategy.
Although the QM pattern does not guarantee a successful trade, it has shown promising results when applied correctly in the forex market. When combined with other technical indicators like moving averages and Fibonacci retracements, the Quasimodo pattern can be a powerful tool for traders at all levels.
In brief, the QM chart pattern is a valuable asset for every fotrader. Understanding its unique features, inspired by the hunchbacked character Casimodo, can significantly enhance trading performance and profitability. However, as with any trading strategy, thorough research before implementation is essential.
External Sources: