Harmonic patterns, such as the ABCD, Three Drives, Gartley, Crab, Bat, and Butterfly patterns, are powerful tools for identifying potential trend reversal points in trading. They allow traders to predict market movements more precisely.
Using these harmonic patterns alongside other tools like Fibonacci charts helps traders operate more confidently and accurately in the market. Combining these two powerful tools—logarithmic and arithmetic charts—provides a unique strategy for forecasting and understanding market movements.
Introduction to 6 Practical Harmonic Patterns:
- ABCD Pattern: This is one of the simplest and most commonly used harmonic patterns, indicating market correction levels and reversal points.
- Three Drives Pattern: This pattern consists of three distinct market moves, helping traders predict a market’s top or bottom.
- Gartley Pattern: Named after H.M. Gartley, this pattern helps identify major reversal points and offers traders high probability setups.
- Crab Pattern: This pattern has the most extreme Fibonacci ratios, offering insight into deep corrections and sharp reversals.
- Bat Pattern: Known for its precision, it helps traders spot trend reversals at a shallow correction level.
- Butterfly Pattern: This pattern is often associated with significant market reversals and has a unique Fibonacci ratio combination.
Tips for Using Harmonic Patterns:
- Patience: Waiting for the complete formation of a harmonic pattern is critical when using it. Premature decisions can lead to trading errors.
- Master Simple Patterns First: Beginners should start with simpler harmonic patterns like ABCD and Three Drives. These patterns highlight key turning points and market movements. Once they gain experience, they can move on to more complex patterns such as Gartley and others.
- Logarithmic and Arithmetic Charts: Mastering these chart types is crucial for conducting precise market analysis. They enable you to interpret price movements more effectively, enhancing your forex trading strategies.
By gaining knowledge and access to the right tools, harmonic patterns can significantly improve your trading decisions and lead to more profitable outcomes.
ABCD Pattern
Starting with one of the most straightforward harmonic patterns, the ABCD pattern, provides a better understanding of harmonic chart basics. This pattern, as simple as the alphabet itself, is formed by adding a single letter to the sequence ABC. You only need sharp eyes and Fibonacci tools to identify this pattern on both logarithmic and arithmetic charts.
In the ABCD chart pattern, the AB and CD lines represent the trend legs, while the BC line shows the corrective and retracement trend. To predict bullish and bearish trends, you can use the Fibonacci tool. In the AB leg, if the BC retracement equals 0.618 of the AB leg, it is expected that the CD leg, using the Fibonacci expansion, reaches the 1.272 level of the BC leg.
The key to successfully using this pattern is patience; wait for the pattern to complete and reach point D before opening your buy or sell position.
Additional Key Rules for Precise ABCD Pattern Analysis:
- Length of AB and CD must be equal: This symmetry and balance in the pattern are crucial for accurate analysis.
- The time taken for price movement from A to B should equal the time needed for the price to move from C to D: You can measure this by counting the number of candlesticks on both arithmetic and logarithmic charts.
By following these rules, you can significantly improve your predictive accuracy in trading based on the ABCD pattern and other harmonic patterns, making you a more skilled and precise trader.
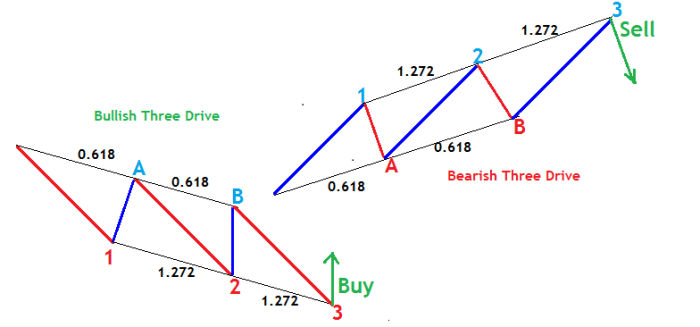
Three-Drive Pattern (Three-Drive)
It is helpful to compare the Three-Drive pattern, one of the more complex harmonic patterns, with the ABCD pattern to gain a deeper understanding. The Three-Drive pattern, essentially an extension of the ABCD pattern, consists of three main legs called “drives.” This pattern, which has both reversal and corrective characteristics, is based on Elliott Wave theory and can be analyzed on logarithmic and arithmetic charts.
Identifying the Three-Drive Pattern
Just like with other harmonic patterns, a high level of precision is required to identify the Three-Drive pattern. It would be best to spot it with sharp observation skills, Fibonacci tools, and patience. In this pattern:
- Point A should retrace 61.8% of the first drive (leg 1).
- Point B should retrace 0.618 of the second drive (leg 2).
- The second drive should extend 1.272 times the length of the first drive (using Fibonacci expansion).
- Similarly, the third drive should extend 1.272 times the length of the second drive.

This symmetrical structure allows traders to predict key reversal points with high accuracy.
Application of Fibonacci in the Three-Drive Pattern
As the Three-Drive pattern follows strict Fibonacci ratios, using Fibonacci retracement and extension tools is crucial. By ensuring that the drives align with the 61.8% and 1.272% Fibonacci levels, traders can confirm the pattern’s formation and plan their trades accordingly.
By mastering the identification and analysis of this pattern, traders can spot potential market reverThree-Drive Pattern: Timing and Trading.
Once the Three-Drive pattern is fully formed, it provides an excellent opportunity to initiate trades. For instance, in a bullish Three-Drive pattern, you can enter a buy trade when leg B extends by 1.272 times the length of leg 2 (Fibonacci expansion). Conversely, in a bearish Three-Drive pattern, the opposite applies.
However, before entering a trade, it’s important to review some fundamental rules:
- The time taken to complete leg two should match the time taken to complete leg 3. This time, symmetry is one of the critical factors in validating the pattern.
- The time needed for the retracements at points A and B should also be equal. This timing harmony in the retracements helps ensure the accuracy of the pattern.
By thoroughly understanding and analyzing this pattern on both logarithmic and arithmetic charts, you can use this knowledge to make more precise market predictions, increasing the chances of success in your trades.
The Gartley Pattern and Its Origins
Harold McKinley Gartley, an innovative and creative analyst in the 1930s, is recognized as one of the pioneers in applying scientific and statistical methods to stock market analysis. His insights helped traders overcome two fundamental challenges: identifying the right timing and selecting the right stocks to buy. Gartley’s strategies quickly gained popularity among traders because they found that his patterns could be applied across various markets.
Since then, numerous books, trading software, and other patterns have been developed based on Gartley’s theories. The Gartley pattern, used in both logarithmic and arithmetic charts, helps traders pinpoint buying and selling opportunities accurately. Gartley patterns, now considered an essential part of financial market analytical tools, are applicable to stocks and other markets.
Understanding and utilizing these patterns on logarithmic and arithmetic charts allows traders to elevate their strategies using advanced analytical techniques. This data-driven approach, rooted in the 1930s, remains one of the most effective methods in financial market analysis and continues to hold its place in the digital age. As a result, Gartley remains a legendary figure in the trading world, with his patterns still guiding traders in various markets today.
The Gartley Pattern (222 Pattern)
The 222 pattern, one of the more complex patterns in technical analysis, is taken from a page in Gartley’s famous book, “Profits in the Stock Market.” This pattern, which includes the foundational ABCD pattern, was developed by Gartley and is often formed when a correction occurs in the overall market trend. For bullish patterns, this correction appears in the shape of an M. For bearish patterns, it resembles a W. These patterns can be analyzed on both logarithmic and arithmetic charts, helping traders identify ideal entry points to join the overall trend.
The Gartley pattern forms when the price follows an upward or downward trend but shows signs of a correction. Its unique feature is that its reversal points align with Fibonacci retracement and extension levels.
Finding this pattern on charts can be challenging, and using all the Fibonacci tools may sometimes be confusing. To avoid confusion, it is recommended that you proceed step by step.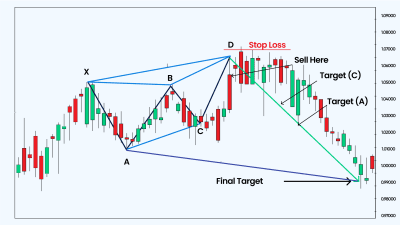
Characteristics of the Gartley Pattern:
The Gartley pattern includes an ABCD bullish or bearish pattern, but before that, there is an X point, which is higher than point D. The “perfect Gartley pattern” has the following characteristics:
- Leg AB should retrace 61.8% of leg XA.
- Leg BC should retrace either 38.2% or 88.6% of leg AB.
- If BC retraces 38.2% of AB, then CD should extend 1.272 times BC. If BC retraces 88.6% of AB, then CD should extend 0.618 times BC.
- Leg CD should retrace 78.6% of leg XA.
By understanding and using this pattern on logarithmic and arithmetic charts, traders can more accurately identify significant market trends and profit from them.
The Crab Pattern in Harmonic Patterns
The Crab pattern, discovered in 2000 by a follower of harmonic patterns, is considered one of the most precise patterns in this field. It can be analyzed on both logarithmic and arithmetic charts and has gained popularity due to the high risk-to-reward ratio it offers. The main advantage of this pattern is that it allows traders to minimize risk by using very tight stop-loss levels.
This pattern’s precision and ability to provide clear entry and exit points make it a valuable tool for traders who want to maximize their profits while keeping risks to a minimum.
Optimized Crab Pattern
The Optimized Crab pattern has specific characteristics that need to be carefully analyzed and evaluated:
- Leg AB should retrace 38.2% or 61.8% of leg XA.
- Leg BC can either retrace 38.2% or 88.6% of leg AB.
- If BC retraces 38.2% of AB, then CD should extend 2.24 times the length of BC. If BC retraces 88.6% of AB, then CD should extend 3.618 times the length of BC.
- Leg CD should extend 1.618 times the length of leg XA.
Using the Crab pattern in analyzing logarithmic and arithmetic charts enables traders to understand the market better and identify precise entry and exit points. This pattern is handy for traders seeking to minimize risk and maximize profits. Understanding this pattern and its application across different markets can help traders develop more effective trading strategies.
Bat Pattern
In 2001, Scott Carney introduced the Bat as a new harmonic pattern. This pattern, easily analyzed on both logarithmic and arithmetic charts, is known for its 0.886 retracement of leg XA, which is identified as a potential reversal zone. The Bat pattern has unique characteristics, which are as follows:
- Leg AB should retrace 38.2% or 50% of leg XA.
- Leg BC can retrace 38.2% or 88.6% of leg AB.
- If BC retraces 38.2% of AB, then CD should extend 1.618 times the length of BC. If BC retraces 88.6% of AB, then CD should extend 2.618 times the length of BC.
- Leg CD should retrace 88.6% of leg XA.
This pattern helps traders identify potential reversal points in the market, enabling them to make more precise trading decisions using logarithmic and arithmetic charts. Due to the Bat pattern’s high accuracy in determining entry and exit zones, it is a valuable tool for traders aiming to reduce risk and optimize their trading opportunities. Correctly understanding this pattern and its application across different markets can assist traders in developing successful trading strategies.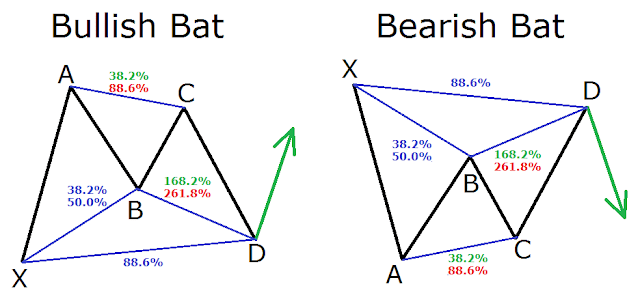
The Butterfly Pattern in Harmonic Trading
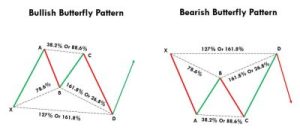
Bryce Gilmore revolutionized technical analysis and harmonic patterns by creating the Perfect Butterfly pattern. This pattern, characterized by the 0.786 retracement of leg AB relative to leg XA, helps identify entry and exit points in both logarithmic and arithmetic charts. The Butterfly pattern has specific features that include:
- Leg AB must retrace 0.786 of leg XA, a critical point in identifying the Butterfly pattern.
- Leg BC can retrace either 0.382 or 0.886 of leg AB, providing flexibility in identifying the pattern under different market conditions.
- If BC retraces 0.382 of AB, then CD should extend 1.618 times BC. If BC retraces 0.886 of AB, then CD should extend 2.618 times BC, indicating significant changes in the market.
- Leg CD should extend 1.27 or 0.618 of XA, helping traders identify potential reversal points accurately.

By understanding this pattern in logarithmic and arithmetic charts, traders can improve their market analysis and recognize profitable opportunities with reduced risk. The Butterfly pattern is a powerful tool in technical analysis and plays a significant role in trading decisions.
Three Steps to Trading with Harmonic Patterns
Effectively using harmonic patterns in market analysis involves identifying, measuring, and determining trading points within these patterns. This process, applicable to logarithmic and arithmetic charts, can help traders achieve significant profits. Here are the three essential steps for using harmonic patterns:
- Identify the Harmonic Pattern: The first step is recognizing harmonic patterns on the charts. This requires high precision and the ability to interpret logarithmic and arithmetic charts to detect patterns like the Bat, Butterfly, and Crab.
- Measure the Ratios of the Harmonic Pattern: After identifying the pattern, the next step is to accurately measure the Fibonacci ratios used within it. These measurements are vital for confirming its validity and determining potential entry and exit points for trades.
- Buy or Sell Once the Harmonic Pattern Completes: The final step is determining the right time to enter or exit trades. Once the pattern is complete, traders can make more precise decisions and identify profitable entry or exit points.
By following these three steps in analyzing logarithmic and arithmetic charts and smartly applying harmonic patterns, traders can improve their trading profitability while minimizing risks. This data-driven and meticulous chart analysis approach allows traders to act more confidently in complex financial markets.
In Conclusion…
The above discussion concludes that harmonic patterns, as powerful tools in technical analysis, play a significant role in trading decisions. These patterns, which can be analyzed on logarithmic and arithmetic charts, help traders identify profitable entry and exit points more accurately. By following the three essential steps—identifying the pattern, precisely measuring Fibonacci ratios, and determining the right time for trading—traders can improve their profitability and reduce the risks associated with their trades. This approach is technically efficient and empowers traders to operate in financial markets with greater confidence and knowledge.