
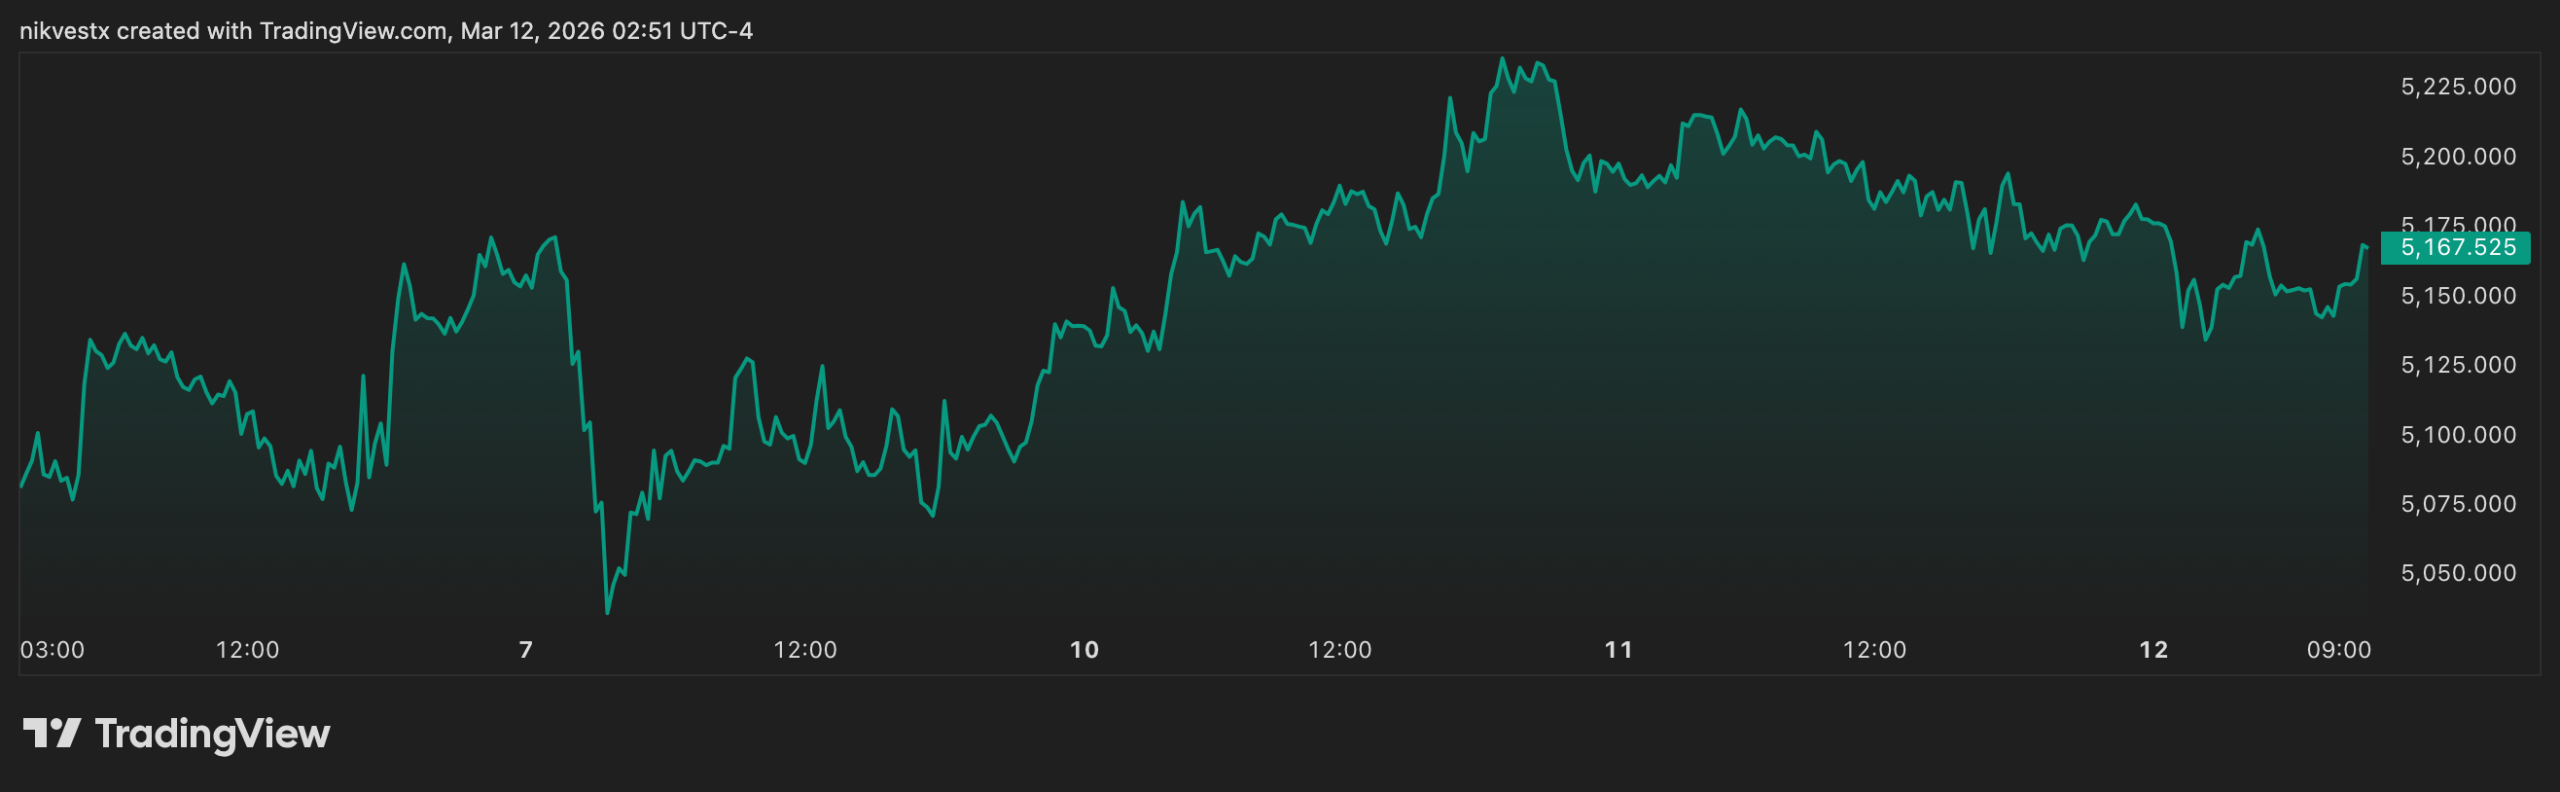
🥇 Gold's Safe-Haven Rally Smothered by Dominant Dollar
March 12, 2026
Gold will face intense algorithmic selling pressure every time it tests local highs against a rising dollar.
Silver will underperform gold due to its industrial applications suffering under a high-rate, low-growth macro environment.
Central bank accumulation of gold will provide a hard floor, preventing catastrophic price collapses.
A sudden reversal in US employment data is the only catalyst capable of unlocking a secular precious metals bull run.
Retail traders are staring at a 9% monthly rip in WTI, glued to the U.S.-Iran headlines, and screaming “Energy Supercycle.” Institutional commodity desks are looking at the exact same $66.52 price tag, running the EIA supply/demand balances, and preparing the mother of all short trades. We are currently living in a physical market distortion. Geopolitical brinkmanship in the Strait of Hormuz has injected a $4–$6 “fear premium” into the front month, masking a terrifying structural reality: a 2.0 to 3.7 million barrel per day (mb/d) global surplus is barreling down the pipeline in 2026. If you are buying naked long oil futures here, you aren’t an investor; you are a geopolitical gambler. Here is the institutional blueprint for fading the panic and harvesting the incoming glut.
📉 Executive Summary: The Structural Oversupply Regime
Trading locally between $65.90 and $66.52/bbl, WTI crude is currently enjoying a six-month high. This strength is a fragile cocktail of escalating nuclear rhetoric, North American winter supply outages (–1.2 mb/d in Jan), and tighter-than-expected OECD commercial stocks.
However, the 2026 macroeconomic reality is overwhelmingly bearish. Fresh February data from the EIA, IEA, OPEC, and Goldman Sachs all converge on a singular truth: non-OPEC+ supply is vastly outpacing global demand growth.
2026 Base-Case Forecast: Expect an annual average of $55.20/bbl (blending the EIA’s $53.42 target with Goldman’s $60 adjustment for tight OECD inventories). The curve is pricing in persistent, widening contango, meaning the market will actively punish long-only holders with a severe negative roll yield (~–12% annualized). This is a structural seller’s market disguised by tactical headline volatility.
📊 The 2026 Execution Roadmap: Quarterly Projections
The path lower will not be linear. It will be characterized by violent geopolitical spikes that must be ruthlessly faded.
| Quarter | Avg Price Target | Institutional Catalysts & Data Anchors |
| Q1 (Ongoing) | $59.80 | The Geopolitical Peak: WTI is supported near $66 locally by the Iran premium and winter disruptions. OPEC+ quotas remain strictly flat through March, preventing an immediate supply shock. |
| Q2 (Jun 30) | $54.50 | The Supply Flood Begins: Post-winter demand fades. Non-OPEC+ production ramps aggressively (Brazil/Guyana add +0.4 mb/d). Inventory builds accelerate to a staggering ~3.0 mb/d pace as OPEC+ likely resumes gradual output hikes. |
| Q3 (Sep 30) | $52.80 | The Demand Disconnect: Peak driving season is entirely offset by record U.S. production (holding at 13.67 mb/d) and a severe slowdown in Chinese strategic stockpiling. Seasonal refinery maintenance caps upside. |
| Q4 (Dec 31) | $51.50 | The Cycle Low: Peak surplus realization hits the tape (IEA projects a massive 3.73 mb/d overhang). Year-end tax-loss selling and normalized winter weather assumptions drag WTI to its lowest baseline. |
⚖️ Probability-Weighted Risk Scenarios
Do not lock into a single bias. Map the probabilities and trade the resulting regime.
60% | Base Oversupply: Annual Average $55.20. Non-OPEC+ adds up to 2.0 mb/d, demand grows a meager 0.85–1.4 mb/d, and inventories swell by over 1.1 billion barrels globally. WTI gets trapped in a grinding $48–$62 range.
25% | Geopolitical Supply Shock: Annual Average $72–$78. Iran exports are fully disrupted (3.3 mb/d offline). Brent spikes above $90 in Q4. WTI tears past $80 in Q2–Q3 as the Strait of Hormuz threat materializes into physical blockades.
10% | Deep Recession + OPEC+ Flood: Annual Average $42–$48. Global GDP snaps below 2.5% on a China hard landing. A fractured OPEC+ abandons quotas, unleashing all 2.2 mb/d of voluntary cuts in a battle for market share. WTI tests sub-$40.
5% | OPEC+ Discipline + EM Demand: Annual Average $64–$68. Saudi Arabia forces cartel discipline to protect its $90 fiscal break-even. Surprise demand beats from India and China (+1.8 mb/d) create a hard $60 floor. Highest reward/risk, lowest probability.
🧠 5 High-Conviction Structural Insights
The Record Inventory Build is Incoming: The EIA STEO projects global builds averaging 3.1 mb/d in 2026. Note that China’s strategic stockpiling is acting as “hidden demand” absorbing ~1.0 mb/d of this.
Non-OPEC+ Supply is the Wrecking Ball: U.S. crude production will flatline at a massive 13.6 mb/d, but the rest of the world (Brazil, Guyana, Argentina) is adding up to 1.2 mb/d of fresh supply. OPEC+ is losing market share daily.
Demand Growth is Bifurcated and Elastic: IEA estimates point to anemic growth (+850 kb/d), with petrochemicals driving over half of the gains. Crucially, demand is highly price-sensitive: every $10/bbl spike destroys 200–300 kb/d of marginal demand globally.
The OECD Divergence Trap: Why is WTI $66 if there’s a surplus? Goldman Sachs notes that OECD commercial stocks are surprisingly tight, receiving only 19% of global inventory builds (down from 27%). The surplus exists, but it is currently hiding in non-OECD floating storage and strategic reserves.
The March 1 OPEC+ Pivot: The “call on OPEC+ crude” drops by 400 kb/d in Q2. Eight key producers have paused production hikes through March, making the upcoming March 1 meeting the ultimate binary catalyst for the rest of the year.
🛠️ The 20-Point Quantitative Trading Arsenal
To survive energy markets in 2026, you must pivot from directional spot trading to relative-value spreads and volatility harvesting.
Spreads & Arbitrage (1–5)
Calendar Spread Widener: Sell the front-month / Buy the 6–12 month contracts to harvest the widening contango (capturing the –10% annualized roll yield).
Crack Spread Synthetic: Go long a 3:2:1 ratio (Gasoline/Heating Oil vs WTI Futures) to isolate and capture refining margin volatility independent of raw crude prices.
WTI-Brent Basis Options: Trade American versus European spread options; expect the WTI discount to narrow as US export strength drains domestic coastal storage.
Seasonal Roll + Convexity Harvest: Systematically trade May–Nov spreads. The US driving season premium historically bakes in a +$4–$6/bbl predictable inefficiency.
Cash-vs-Futures Basis Trading: Exploit physical WTI at Cushing versus NYMEX paper. Storage arbitrage becomes highly profitable when inventories cross the 5-year average.
Volatility & Derivatives (6–10)
6. OPEC-Meeting Straddles: Buy At-The-Money (ATM) straddles exactly one week before the March/June/July cartel meetings. Sell immediately post-announcement to monetize the IV crush.
7. Geopolitical Risk Premium Decay: Aggressively sell Out-Of-The-Money (OTM) calls 48 hours after a major Iran headline. The geopolitical premium mathematically mean-reverts within 4–6 weeks.
8. Delta-Neutral Volatility Scalping: Run a dynamic delta-hedged strangle portfolio on CL options, targeting the 30–45 day gamma window for theta decay.
9. Butterfly Condor on Low-Vol Regimes: Sell the wings and buy the body when the 30-day Implied Volatility drops below the historical 25th percentile.
10. Iron Condor on Range-Bound Q3: Deploy a neutral strategy targeting the $50–$55 band during the post-summer shoulder season.
Macro-Quant & Algo Overlays (11–15)
11. Ornstein-Uhlenbeck Mean-Reversion Algo: Deploy statistical arbitrage targeting deviations between 30-day and 90-day realized volatility.
12. Machine-Learning Regime Detection: Use a Hidden Markov Model (HMM) fed with DXY and inventory data to programmatically switch between trend-following and mean-reversion.
13. Quantitative Supply-Demand Overlay: Run a real-time regression script that scrapes weekly EIA/IEA data releases to mechanically adjust your directional bias.
14. Pairs with DXY & 10-Yr Yield: Short WTI / Long USD specifically when the 20-day inverse correlation spikes above 0.75.
15. Cross-Commodity Spark Spread: Trade the WTI versus Henry Hub Natural Gas ratio to capitalize on utility power-generation switching.
Technical & Risk Management (16–20)
16. Elliott Wave + Fibonacci Clusters: Target 61.8% retracements on the weekly chart to bid counter-trend longs near the $50 structural floor.
17. Futures Curve Steepener: Long Q4 2026 vs Q2 2026 futures when the curve violently flips from backwardation to deep contango.
18. Roll Yield Capture via ETN/ETF: Systematically rotate between front-month and second-month contracts in USO/BNO to avoid negative roll drag.
19. Covered Call Writes on BNO/USO: Sell monthly 30-delta calls against your core ETF holdings whenever the VIX-equivalent oil volatility spikes above 35%.
20. Tail-Risk Hedging with Deep OTM Puts: Allocate 10–15% of your portfolio’s risk budget to Dec 2026 $35 puts. This is dirt-cheap insurance against the 10% “Deep Recession + OPEC+ Flood” scenario.
The Final Execution Protocol:
WTI in 2026 is a structural seller’s market on the macro level, but a tactical trader’s paradise on the micro level. The base-case downside is cushioned by OPEC+ discipline, while the upside is dominated by fat-tail geopolitical risks. Do not get married to a directional long position here. Your edge lies in trading the curve shape (contango) and fading the geopolitical volatility spikes. Risk Overlay: Cap portfolio risk at 2–3% per trade. Utilize 30-day trailing ATR stops to avoid getting steamrolled by sudden headline algos. Monitor the CFTC Commitment of Traders (COT) report strictly—when large speculators flip net short, that is your contrarian signal to cover.

Physical Dominance: Architecting the Geopolitical Fracturing of Global Commodities
Let’s diagnose a fundamental shift in the 2026 macroeconomic landscape. For the last decade, investors have been obsessed with “Digital Scarcity” and software-driven multiples. Today,

The Macroeconomic Repricing: Crude Volatility, Gold’s Critical Test, and the Return of Dollar Supremacy
Let’s diagnose a massive structural shift currently shaking the global markets. Retail operators are getting whipsawed by sudden drops in crude oil and precious metals,

Gold Records Worst Week in Decades
Precious metals are taking a massive hit as geopolitical fears ironically fail to outweigh shifting rate cut bets. Gold prices extended a vicious losing streak

Gold Plunges 9% Defying War-Time Logic
The ultimate safe haven is acting like a risk asset as rates crush bullion appeal. Gold plummeted to roughly $4,556 per ounce, wiping out

Forecast and Strategic Assessment: Global and Regional Trajectories Following the Decapitation of the Iranian Regime
The geopolitical architecture of the Middle East, and by extension the broader international system, has reached a profound and irreversible inflection point following the unprecedented

The Structural Decoupling: Trading the $6,200 Gold Regime Shift in 2026
🥇 Gold’s Safe-Haven Rally Smothered by Dominant Dollar March 12, 2026 Gold will face intense algorithmic selling pressure every time it tests local highs against

The $5,205 Breakout: Trading the Tariff Panic and the Geopolitical Safe-Haven Supernova
Retail traders are staring at a five-day vertical streak in gold, watching it smash through $5,180 to tag $5,205 intraday, and they are desperately waiting

The Fear Premium: Why US-Iran Brinkmanship Just Broke the Golden Rule
When the drums of war beat loud enough, the fundamental laws of finance temporarily cease to exist. Textbooks tell you that when the US Dollar

The 2025 “Divergence” Report
2025: The Year the Market Sold ‘The Future’ to Buy ‘The Periodic Table’. 1. Silver (+130%): The “Industrial Squeeze” of the Century Status: Asset of

Forex & Commodities: The Monday Gap
1. Gold’s “Safe Haven” Premium While crypto bleeds, the yellow metal is holding the line at $4,300. Gold (XAU/USD) is currently trading at $4,337.85, pushing

Global Macro: The “Peace Shock” & The Golden Hedge
1. Crude Oil (WTI): The Geneva Peace Talks Crash Peace is profitable for humanity, but catastrophic for oil bulls. WTI Crude has plummeted to $58.00

Forex & Commodities Pulse: Riding the Waves of Uncertainty in Late 2025
As we hit November 21, 2025, the forex and commodities arenas are a whirlwind of shifting sentiments. The US Dollar is clawing back ground amid

The $4,000 Crossroads: Deep Analysis of Forex, Commodities, and Macroeconomic Tides
The current market sentiment is generally risk-off, driven by persistent macroeconomic uncertainty, hawkish signals from the Federal Reserve, and geopolitical tensions. This has led to strong dollar performance, pressure on commodities like Gold and Oil, and a deep correction in the high-momentum Tech and Crypto sectors.

Forex & Commodities: The Age of Strategic Divergence
The market narrative for November 2025 is one of profound and irreversible divergence. We are witnessing a “Great Un-mooring,” where asset classes are no longer

Forex & Commodities: USD Strength and Geopolitical Twists Redefine the Landscape
The world of currencies and raw materials feels like a high-stakes game these days, with the dollar’s comeback throwing shade on everything from gold to

Major Forex & Commodities News | November 12 2025
Just as the market priced in “higher for longer,” a key Fed official just reignited hopes for a December rate cut, sending the Dollar tumbling.

Major Forex & Commodities News | November 11, 2025
1. Gold’s Hyperdrive: The $4,100 Breakout Is Here The government shutdown is ending, and the dollar is stumbling. Gold just hit the ignition switch. Gold

Trading GOLD (XAU/USD) in October 2025: Forecasts, Trends, Signals & Predictions
Table of Contents Introduction: Why Gold Dominates Global Market Sentiment Discover how gold’s ancient allure translates into a modern barometer for global economic health, influencing

September 2025 Forecast, Analysis and Price Predictions: XAU/USD (Gold)
1. Introduction: The Enduring Importance of Gold in September 2025 As we navigate the complexities of the global financial landscape in September 2025, gold (XAU/USD)

Gold (XAU/USD) August 2025 Forecast: Expert Strategies & Insights
Gold (XAU/USD), the premier safe-haven asset, remains a cornerstone of commodities trading, reflecting global economic uncertainties and monetary policy shifts. As we approach August 2025,
Retail traders look at the $5,158 price tag and the staggering 76.8% year-over-year gain and scream “bubble.” Institutional capital looks at the exact same chart and sees a permanent structural regime shift. Gold has officially decoupled from its traditional cyclical drivers, transforming into a hybrid reserve asset in a de-dollarizing, high-debt world. Central banks, not retail speculators, are now the marginal buyers. If you are waiting for a pullback to $4,000, you are trading a macroeconomic regime that no longer exists. The Reuters median forecast of $4,746 is already wildly stale. Here is the institutional blueprint for navigating the gold market’s path to $6,200.
📉 Executive Summary: The Ultimate Hybrid Asset
Trading locally around $5,158, XAU/USD is digesting its recent parabolic advance to the $5,608 all-time high. Despite the intraday pullbacks, the month-over-month trend remains positive.
The core thesis for 2026 is built on an unrelenting structural bid. Every major banking house (JPM, UBS, Goldman Sachs) that updated their models post-$5,000 has lifted targets by 15–30%. The market is transitioning into a phase where gold acts as the ultimate portfolio volatility hedge against sticky inflation and geopolitical uncertainty.
2026 Base-Case Forecast: Expect a year-end target of $6,200 (±8%). The probability-weighted range across institutional analysts sits between $5,800 and $6,500, implying a minimum +10% average premium ($5,650) from the current spot price.
📊 The 2026 Execution Roadmap: Quarterly Projections
The trajectory of gold through 2026 is dictated by real-yield compression and the rhythm of institutional portfolio rebalancing.
| Quarter | End-Date Target | Institutional Catalysts & Data Anchors |
| Q1 (Mar 31) | $5,400 | The Consolidation Phase: Post-correction digestion after the January spike. The market is supported by strong seasonal physical demand and EM year-start allocations. The Fed is expected to hold rates at 3.50–3.75%, allowing gold to build a psychological floor above $5,000. |
| Q2 (Jun 30) | $5,650 | The Liquidity Pivot: The market prices in the first Fed cut (assuming core PCE trends toward 2.2–2.4%). Summer ETF inflows historically accelerate during this window. Central bank buying remains relentless at a baseline of ~190 tonnes per quarter. |
| Q3 (Sep 30) | $5,900 | The Real-Yield Squeeze: Geopolitical premiums peak ahead of the US mid-term elections. Real 10-year TIPS yields likely compress below 1.0%, effectively overriding traditional summer seasonal weakness with a massive structural bid. |
| Q4 (Dec 31) | $6,200 | The Rebalancing Climax: Institutional portfolio rebalancing and year-end central bank reporting windows close. This is historically the strongest quarter for physical bar and coin demand, locking in the $6,200 consensus zone. |
⚖️ Probability-Weighted Risk Scenarios
Do not trade a single deterministic outcome. Map the macro probabilities to manage your portfolio’s tail risk.
55% | Base Case (Structural Diversification): Year-end $5,800–$6,500. Central banks acquire ~750 tonnes. The Fed cuts 1–2 times amid moderate geopolitical risks. Gold is formally cemented as a “neutral” reserve asset.
25% | Super-Bull (Crisis Acceleration): Year-end $7,000–$8,500. Major conflict escalation triggers panic buying by Emerging Market central banks (>1,000 tonnes). Aggressive Fed easing collapses the dollar. Gold assumes the role of a primary global reserve.
15% | Mild Bear (Consolidation): Year-end $4,200–$5,100. US growth surprises to the upside. Tariffs successfully boost domestic manufacturing, triggering a massive USD rally. The Fed holds or hikes, restoring the “risk-on + strong dollar” paradigm.
5% | Stagflation Volatility: Year-end $5,500–$7,200 (Wide Range). Sticky inflation (>3%) collides with slowing growth. Gold trades exactly like it did in the 1970s—punishing multi-hundred-dollar swings, but with a relentless upward bias.
🧠 5 High-Conviction Structural Insights
The Central Bank Bid is Structural, Not Cyclical: Central banks purchased 863 tonnes in 2025—still 4× the 2010–2021 average despite prices eclipsing $5,000. This single flow covers ~23% of annual mine supply. Shifting global reserves from 20% to 25% requires another 2,000–3,000 tonnes of cumulative buying.
The Investor Allocation Shift Has Barely Started: Institutional and retail holdings sat at a mere 2.8% of AUM in late 2025. Moving to just 4.0–4.6% implies an additional +1,200 to +2,600 tonnes of mechanical demand.
Extreme Real-Yield Sensitivity: Gold’s beta to 10-year TIPS yields is massive (–8% to –10% per 50 bps move). With current real yields around 1.2%, a plausible compression to 0.6–0.8% by year-end mathematically justifies an additional +15–20% repricing.
De-Dollarization is Now Quantifiable: Official gold holdings now account for ~20% of global reserves. However, emerging market central banks with <10% gold exposure still dominate FX reserves. The room for massive notional rotation out of fiat remains immense, even at $6,000/oz.
The Supply-Demand Math is Bullish: Mine supply is flat-to-down due to energy costs and permitting gridlock. Recycling is muted because gold is increasingly being pledged as collateral (over 200 tonnes pledged in India alone). The market requires ~585 tonnes/quarter just to hold prices flat, and demand is currently running far above that.
🛠️ The 20-Point Quantitative Trading Arsenal
To extract alpha from a high-volatility, structural bull regime, abandon retail indicators. Deploy these institutional-grade quantitative overlays:
Macro-Quant & Statistical Arbitrage (1–5)
Real-Yield Fair-Value Regression: Regress gold against 10-year TIPS, breakevens, and the DXY. Trade 1.5–2σ deviations with a 3–6 month swing horizon.
Intermarket GRAM Model: Build a Goldman-style regression tracking real rates, USD, and geo-risk premiums. Overlay with machine-learning residuals to spot pricing anomalies.
Macro Regime-Switch Model: Utilize a Bayesian probability matrix (rates vs. geopolitics vs. growth) to seamlessly toggle your algorithms between trend-following and mean-reversion.
Machine-Learning Sentiment Dashboard: Aggregate X (Twitter) and news sentiment alongside volume data; execute on 24-hour lagged signals to fade retail panic.
DXY Correlation Breakout: Monitor the 20-day correlation. When the inverse correlation breaks (goes below –0.7), use it as a trigger for long gold entries with tight stops.
Volatility & Event-Driven Options (6–11)
6. Volatility Term-Structure Arbitrage: Trade the ratio between the VIX and GVZ (Gold Volatility Index) when the spread breaches historical bounds.
7. Gamma Scalping ATM Straddles: Execute when implied volatility drops below realized volatility (common in quiet consolidation periods). Delta-hedge intraday to harvest the chop.
8. Butterfly / Condor Skew Plays: Sell the wings when Vanna exposure is mispriced just ahead of known FOMC or NFP binary events.
9. Geopolitical Event-Driven Options: Buy cheap Out-Of-The-Money (OTM) calls 30–60 days to expiration ahead of major known risk windows (elections, global summits).
10. Options Delta-Hedged Covered Calls: Execute on physical ETFs when Implied Volatility (IV) rank exceeds 70% to generate yield while retaining upside exposure.
11. Carry-Adjusted Forward Curve: Compare physical gold lease rates against USD funding costs. Arbitrage the spread when lease rates aggressively spike.
Intermarket & Flow Tracking (12–16)
12. Central-Bank Flow Tracking: Monitor weekly IMF COFER data and WGC monthly reports to actively front-run reported sovereign buying spikes.
13. XAU/XAG Ratio Mean-Reversion: Trade the Gold/Silver ratio bands (currently ~82–85) utilizing options when the ratio stretches >2σ from the 200-day moving average.
14. Gold vs. GDX/GLD Spread Trading: Execute statistical pairs trades (Long Miners / Short Physical) when the beta deviation exceeds 15%.
15. Calendar-Spread Futures Arbitrage: Roll Dec–Feb or Jun–Aug contracts when contango exceeds normalized levels to capture carry and roll yield.
16. COT Positioning Extremes: Fade net speculative longs when they breach the 80th percentile only if commercials are simultaneously net short (historical edge >65%).
Technical & Risk Management (17–20)
17. Elliott Wave + Fibonacci Clusters: Map multi-timeframe confluence zones for precise entries. Assume 2026 is a massive Wave 3 extension.
18. Ichimoku Cloud + Kijun-Sen Dynamic: Utilize cloud twists purely as major macro trend filters on the weekly timeframe to avoid getting chopped out by daily noise.
19. Seasonal + Macro Overlay: Build a probability matrix combining Q1 physical strength metrics with post-Fed cut rally probabilities.
20. Risk-Parity Portfolio Sizing: Stop sizing gold like a speculative stock. Allocate it strictly as a volatility-adjusted diversifier, targeting an 8–12% portfolio volatility contribution.
The Final Execution Protocol:
Gold in 2026 is not about “will it go up?” The base case is structurally higher prices coupled with intense volatility. The real alpha is generated through precise scenario weighting, quarterly execution, and advanced derivatives overlays. Treat gold as the core strategic asset of the 2020s. Position accordingly, hedge your tail risks, and let the structural central bank bid do the heavy lifting.


