Retail traders open their brokerage apps, see a list of six-letter acronyms like “EURUSD” or “GBPJPY,” and treat them like independent stocks. They buy the Euro because they think Europe is doing well, completely ignoring the second half of the equation. This fundamental misunderstanding is why retail capital is systematically harvested by institutional desks. In the foreign exchange market—a $9.6 trillion daily behemoth—you are never simply buying an asset. You are executing a simultaneous long/short relative-value transaction between two sovereign monetary policies. A currency pair is not a ticker; it is a macroeconomic tug-of-war. If you are trading these pairs without understanding their distinct personalities, baseline volatilities, and mathematical correlations, you are trading blind. Here is the institutional blueprint for deconstructing forex pairs, understanding their microstructure, and engineering a quantifiable edge.
📉 Executive Summary: The Mechanics of Relative Value
Every forex pair follows the strict ISO 4217 convention: a three-letter code for the Base currency, followed by a three-letter code for the Quote currency.
When you look at EUR/USD = 1.0850:
The Base Currency (EUR): This is the transactional unit. It is the currency you are effectively buying or selling.
The Quote Currency (USD): This is the pricing unit. It tells you exactly how much of the quote currency is required to purchase one unit of the base currency (1 Euro costs 1.0850 US Dollars).
The mechanics of execution are absolute:
Going Long (Buying the Pair): You are buying the Base currency and simultaneously shorting the Quote currency. You profit if the Base strengthens or the Quote weakens.
Going Short (Selling the Pair): You are shorting the Base currency and simultaneously buying the Quote currency. You profit if the Base weakens or the Quote strengthens.
The Core Paradigm Shift: There is no such thing as “absolute” value in forex. If EUR/USD is dropping, it does not necessarily mean the Euro is crashing; it could simply mean the US Dollar is experiencing a massive, systemic rally across the board. You must trade the relationship, not the isolated currency.
📊 The Execution Roadmap: Pair Classifications & Personalities
Not all pairs are created equal. The 2026 forex landscape is strictly segregated by liquidity, spread costs, and behavioral “personalities.” You must match your trading strategy to the correct classification.
| Classification | Key Pairs | Institutional Characteristics & Execution Strategy |
| The Majors | EUR/USD, USD/JPY, GBP/USD, AUD/USD, USD/CAD, USD/CHF | The Liquidity Ocean: These pairs include the US Dollar and account for ~85% of global volume. They offer the tightest spreads (0.1–1.0 pips) and the cleanest technical price action. Strategy: Aggressive intraday scalping, momentum breakouts, and heavy algorithmic trend-following during the London/NY overlap. |
| The Minors (Crosses) | EUR/GBP, EUR/JPY, GBP/JPY, AUD/JPY | Regional Divergence: These pairs bypass the US Dollar. They are driven by localized policy divergence (e.g., ECB vs. BOE). Spreads are moderate. Strategy: Excellent for mean-reversion (EUR/GBP often ranges) or capturing violent, extended trends (GBP/JPY “The Beast” is notorious for massive ATR expansion). |
| The Exotics | USD/TRY, USD/ZAR, USD/MXN | The Volatility Vacuum: A major currency paired with an emerging market currency. Liquidity is incredibly thin, spreads are massive (10–100+ pips), and slippage is severe. Strategy: Strictly reserved for long-term swing/position trading based on extreme macroeconomic carry-trade advantages or systemic crisis events. Intraday trading is mathematical suicide. |
⚖️ Probability-Weighted Risk Scenarios (Correlation Risk)
Forex pairs do not move in a vacuum. Because the US Dollar is involved in 89% of all trades, pairs are heavily tethered to one another mathematically. Failing to understand correlation is the #1 cause of hidden leverage blow-ups.
60% | The Standard Dollar Move (High Correlation): The Federal Reserve hikes rates. The USD surges globally. EUR/USD drops, GBP/USD drops, and AUD/USD drops. If you are Long EUR/USD and Long GBP/USD simultaneously, you haven’t diversified; you have simply doubled your risk against the US Dollar.
25% | The Risk-On/Risk-Off Flow (The Safe Haven Pivot): A global crisis hits. Equities dump. High-yield “risk” currencies (AUD, NZD) are aggressively sold, while capital floods into “safe-haven” currencies (JPY, CHF, USD). Pairs like AUD/JPY will violently collapse, regardless of standard technical support levels.
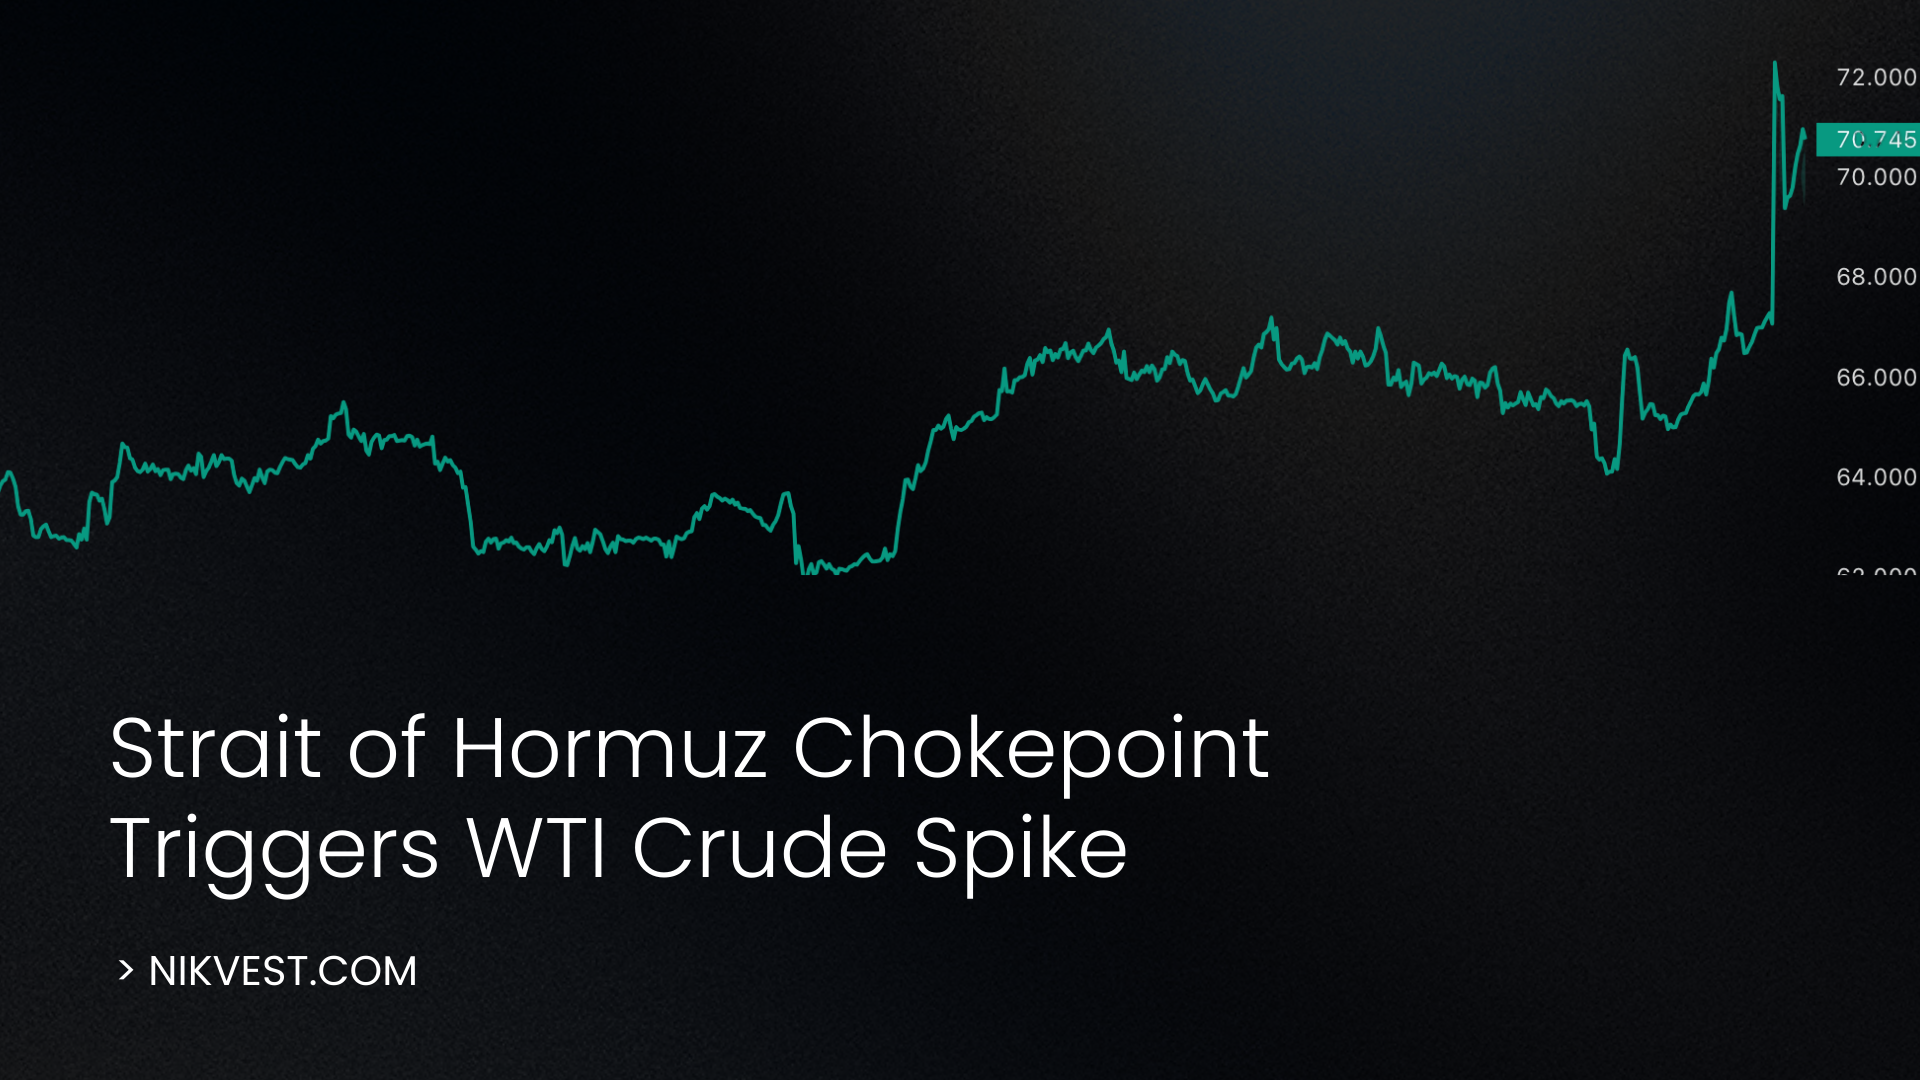
10% | The Commodity Driver (Intermarket Shock): Oil prices surge on Middle East tensions. The Canadian Dollar (CAD), highly correlated to crude exports, aggressively strengthens. USD/CAD drops sharply, decoupling from the standard USD index (DXY) basket.
5% | The Correlation Break (Statistical Arbitrage): EUR/USD and GBP/USD (historically highly correlated, +0.85) suddenly diverge due to localized UK news. One drops while the other grinds higher. Quants use this 2-sigma deviation to execute mean-reversion pairs trades, betting the historical correlation will snap back.
🧠 5 High-Conviction Structural Insights
The Interest Rate Engine: Forex is fundamentally driven by yield. Capital flows to where it is treated best. If the Reserve Bank of Australia offers 4.5% interest and the Bank of Japan offers 0.25%, institutional capital will borrow JPY to buy AUD (The Carry Trade). This structural flow dictates the macro trend of AUD/JPY.
The Spread is the True Cost: The Bid/Ask spread is an immediate tax on your trade. If you trade an exotic pair with a 20-pip spread, you start the trade instantly down 20 pips. This mathematically destroys any short-term scalping strategy on exotics or minor crosses.
Pip Value Asymmetry: A 50-pip stop loss on EUR/USD does not cost the same amount of dollars as a 50-pip stop loss on GBP/JPY or USD/CAD. Pip values fluctuate based on the quote currency. You must dynamically recalculate your lot size for every single pair to maintain a strict 1% risk threshold.
The Time-of-Day Liquidity Trap: Trading AUD/USD during the London/NY overlap is fine, but the pair’s true fundamental catalysts (RBA rate decisions, Chinese economic data) occur during the Asian session. Matching the pair to its native liquidity timezone is critical for capturing clean, news-driven momentum.
Triangular Arbitrage (The Consistency Check): The value of EUR/GBP is not arbitrary; it is a mathematical derivative of EUR/USD and GBP/USD. ($EUR/GBP = EUR/USD \div GBP/USD$). While retail traders cannot execute high-frequency arbitrage, understanding this triad is crucial. A massive move in EUR/USD will violently force a repricing in EUR/GBP.
🛠️ The 20-Point Quantitative Execution Arsenal
To extract alpha from currency pairs, you must combine macroeconomic drivers with strict quantitative risk management.
Macro & Correlation Mechanics (1–6)
The Carry Trade Filter: When taking a long-term swing trade, check the swap rates. Only execute in the direction of positive carry (where the Base currency’s interest rate is higher than the Quote currency’s). Get paid to wait.
Dynamic Correlation Matrices: Do not rely on static assumptions. Use a 30-day rolling Pearson correlation matrix (via MyFXBook or TradingView) to check the real-time relationship between pairs before opening multiple positions.
The Intermarket Overlay: If trading USD/CAD, you must have WTI Crude Oil on your secondary monitor. If trading AUD/USD, you must track Gold. Currency pairs are derivatives of their nation’s primary exports.
The Safe-Haven Proxy: During periods of extreme VIX expansion (stock market panic), default to shorting risk-proxies (AUD/JPY, NZD/CHF).
The DXY Baseline: Never trade a major pair (EUR/USD, GBP/USD) without first analyzing the US Dollar Index (DXY) chart to determine the baseline momentum of the global reserve currency.
Central Bank Divergence Scanning: The highest probability macro trades occur when one central bank is actively hiking rates while the opposing central bank is actively cutting. Map the dot-plots.