


The Energy Stagflation Bleed: EUR/USD April Forecast
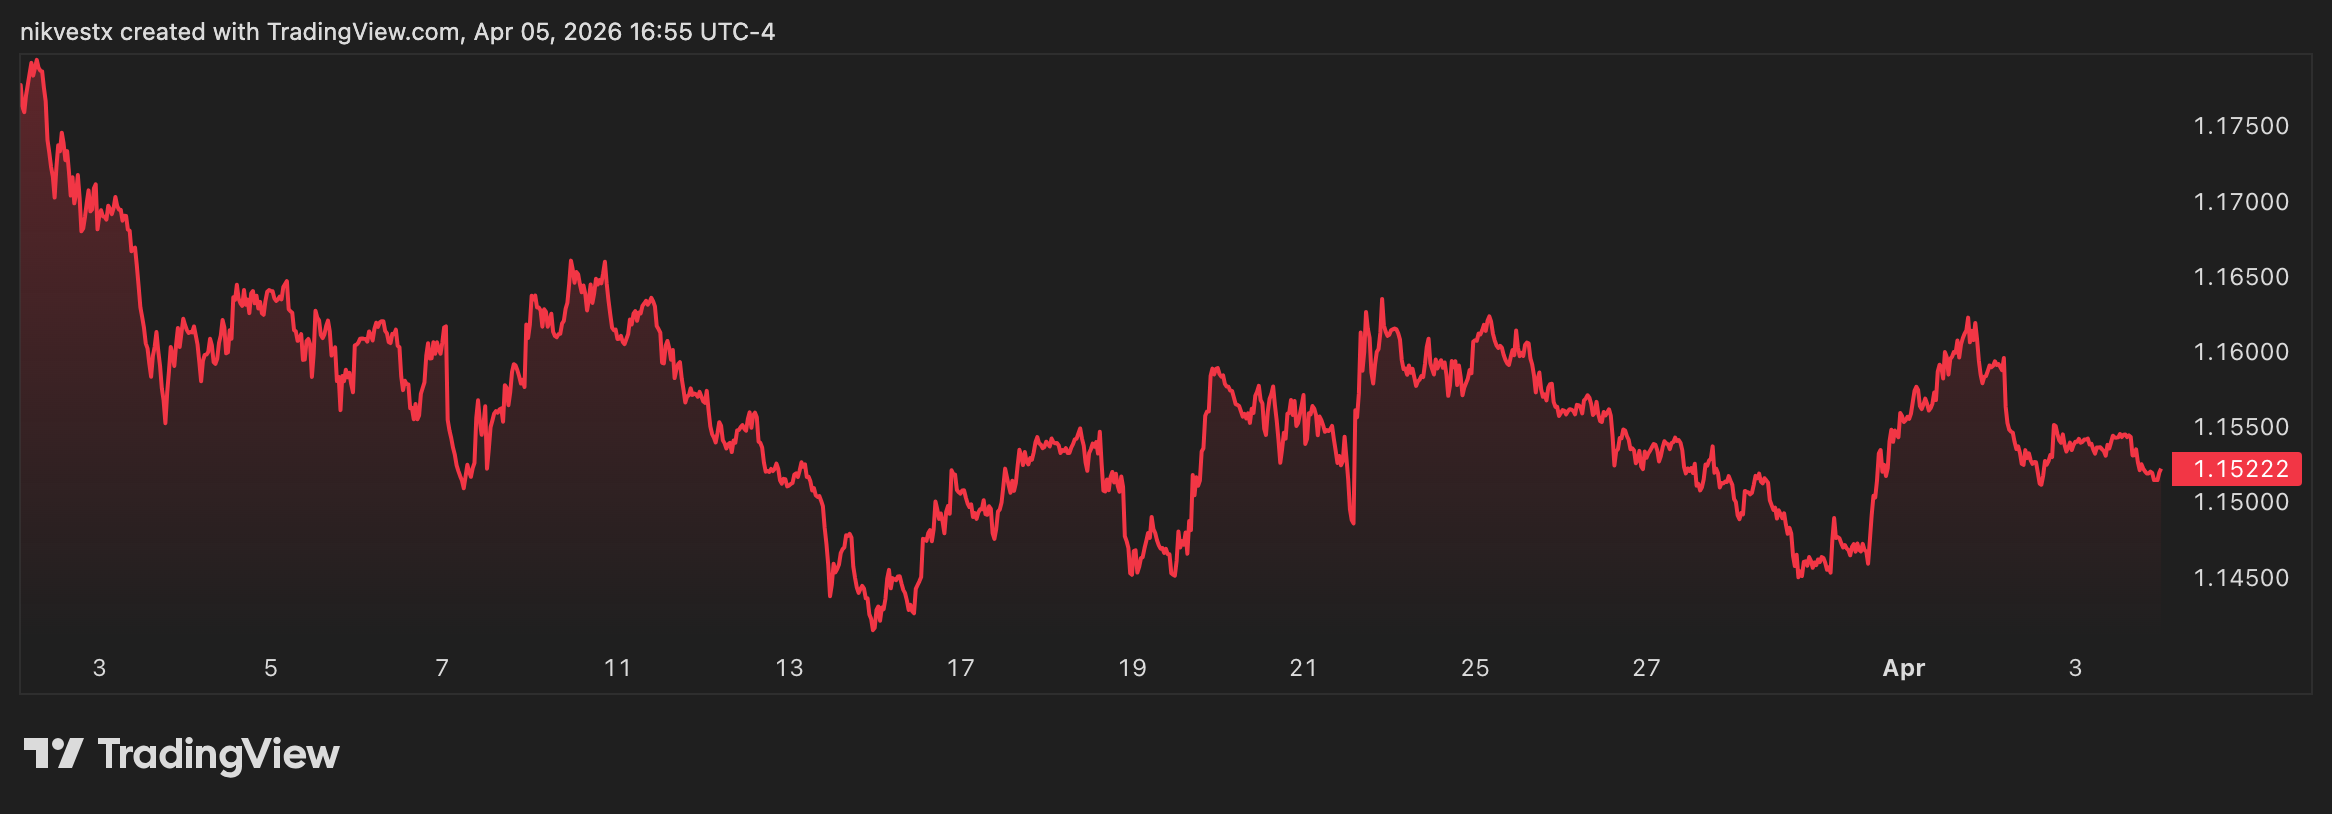
Europe is choking on $112 crude oil. The US Dollar is the only game in town as stagflation fears grip the Eurozone. Signal: SHORT (Sell the Relief Grind) 6 Major Levels: 1.1650 (Resistance – Flipped Ceiling) 1.1598 (Resistance – Algorithmic Supply) 1.1520 (Current Active Price) 1.1475 (Support – The “King” Level / Capitulation Wick) 1.1400 (Support – Options Barrier) 1.1350 (Target – Institutional Abyss Level) April Price Prediction and Forecast: The European Central Bank is entirely trapped. They are facing severe energy-driven inflation spikes just as their industrial core begins to contract. They cannot hike rates without collapsing their economy, yet holding rates steady destroys the Euro against a hawkish Federal Reserve. Every minor rally on the EUR/USD chart is simply algorithmic short-covering. Probabilities: 70% probability of a continued breakdown as energy prices remain elevated; 30% chance of choppy stabilization if Middle East tensions unexpectedly de-escalate. April Prediction: Gravity takes hold. The pair will likely slice through the 1.1475 macro wick and settle near the 1.1400 options barrier.
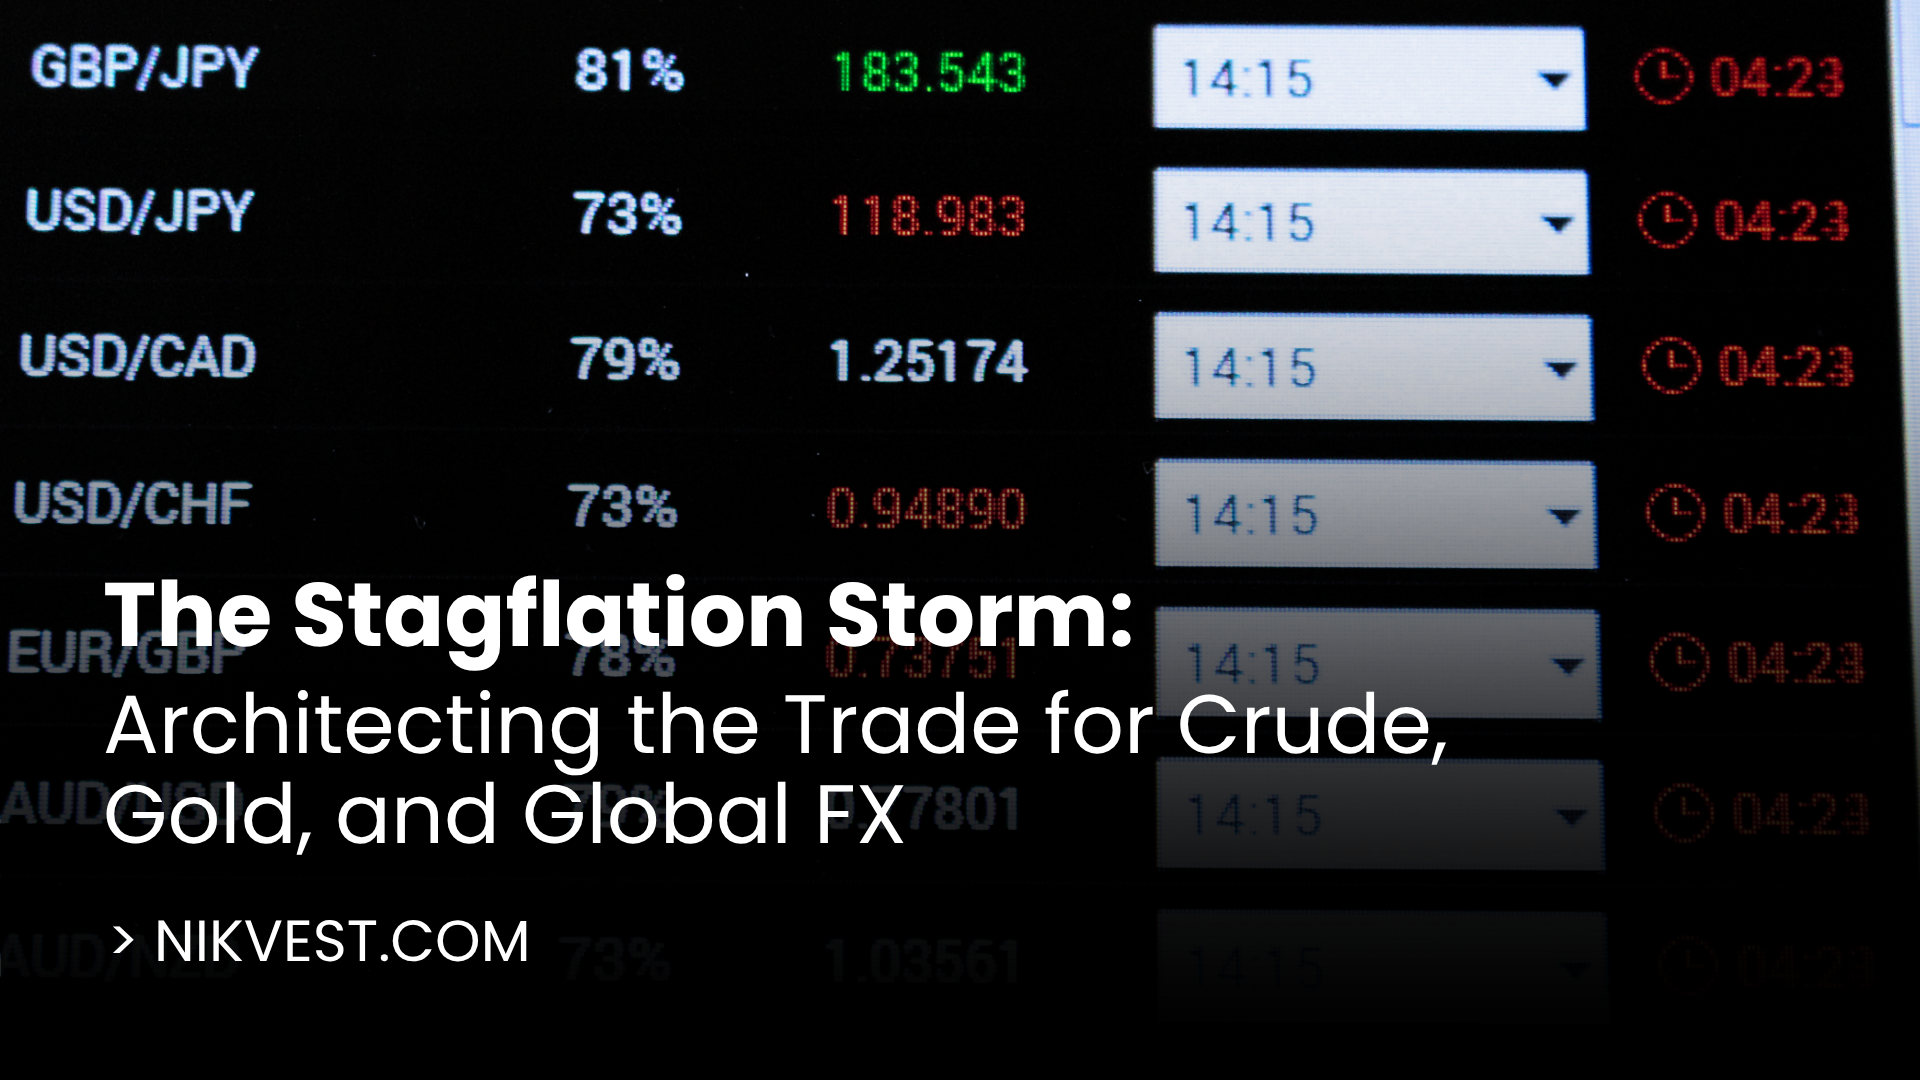
The Stagflation Storm: Architecting the Trade for Crude, Gold, and Global FX
Let’s diagnose the current macroeconomic reality. The vast majority of retail traders are getting chopped to pieces trying to trade technical ranges on 15-minute charts. They are ignoring the massive geopolitical and structural shifts that are completely rewriting the global liquidity map. Institutional operators do not trade lines on a screen; they trade global energy flows, fiat devaluation, and central bank divergence. With WTI Crude smashing resistance, Gold achieving escape velocity, and major FX pairs coiling for explosive breakouts, the stagflationary environment is officially here. Here is the straightforward, high-IQ architecture of the modern macro market and how to position your capital. Part I: WTI Crude and the Hormuz Escalation The global energy market is no longer pricing in standard supply and demand mechanics. It is entirely repricing geopolitical risk. With the sudden escalation of US-Iran tensions and the strict 48-hour deadline regarding the Strait of Hormuz, a severe supply shock has transitioned from a tail risk to a baseline probability. This forced a massive short-covering squeeze, sending WTI up 14% overnight to $114. For institutional operators, this is the ultimate stagflationary catalyst. If the diplomatic deadline passes without resolution, the primary technical upside target shifts aggressively to the $120

The Macroeconomic Repricing: Crude Volatility, Gold’s Critical Test, and the Return of Dollar Supremacy
Let’s diagnose a massive structural shift currently shaking the global markets. Retail operators are getting whipsawed by sudden drops in crude oil and precious metals, assuming they are just buying a standard dip. They are not. We are witnessing a fundamental macroeconomic repricing driven by sticky inflation, central bank divergence, and relentless algorithmic liquidation. If you are trading isolated charts without understanding the underlying flow of global capital, you will get run over. Here is the straightforward, high-IQ architecture of the Q2 2026 financial landscape and how to position your capital. Part I: The Energy Whiplash (WTI Crude) Oil markets are facing severe whiplash. WTI crude just plummeted nearly 17% from its weekly highs—the largest single-day drawdown since 2022—and is currently hovering near the $99.64 per barrel mark. Amateurs attribute this erratic movement purely to news noise. Professional operators recognize that algorithmic trading desks are aggressively repricing the geopolitical risk premiums tied to the Middle East. For macroeconomic strategists, this complicates inflation forecasts. However, the immediate technical reality is undeniable: if the $95 support level breaks, expect a cascading wave of commodity liquidations. Energy-heavy indices will drastically underperform tech in the short term as producers aggressively hedge their downside risk.
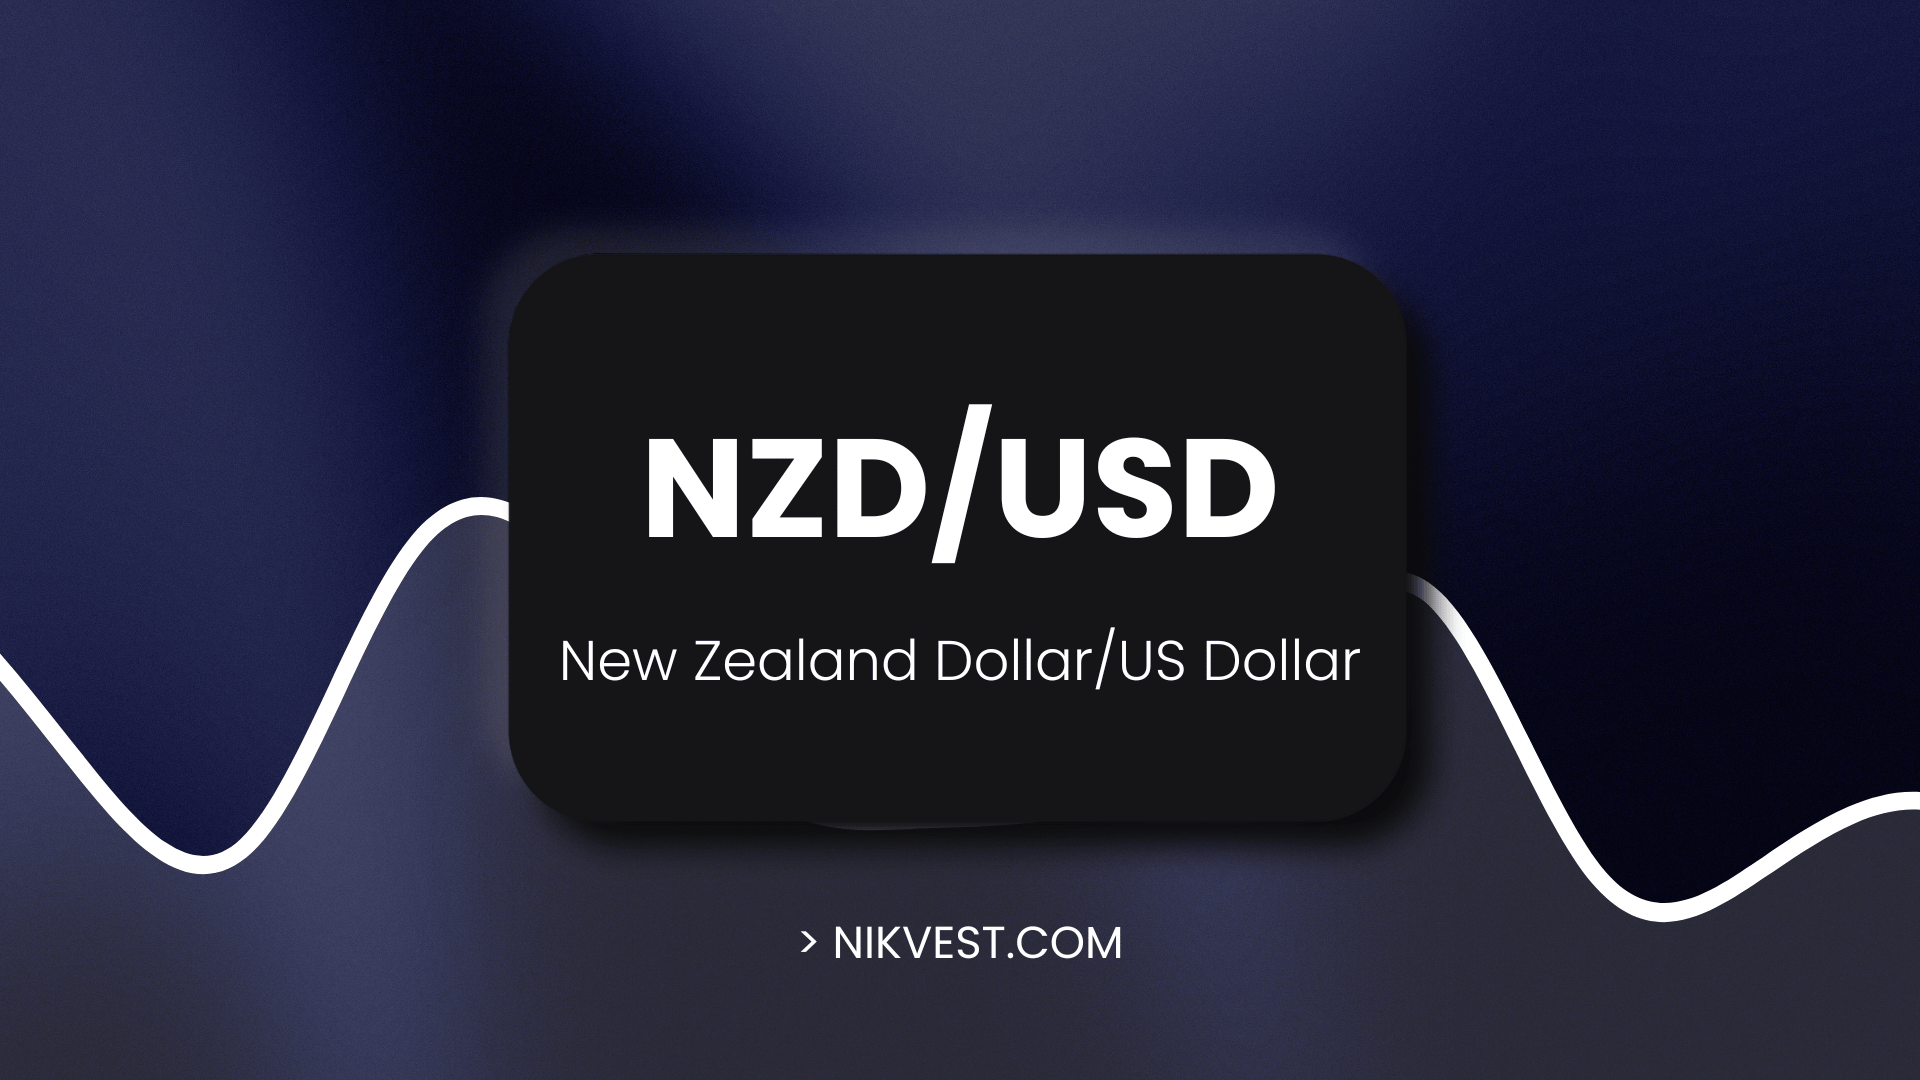
NZD/USD (New Zealand Dollar / US Dollar): “The Kiwi”
NZD/USD: The Sympathy Bleed 📅 Mar 26, 2026 The Kiwi is trading like a weaker derivative of the Aussie Dollar. It is in freefall with highly bearish technicals across all timeframes. 📊 Today’s Forecast & Analysis: The Signal: SHORT (Breakdown Execution) Entry Zone: 0.5760 – 0.5780. Stop Loss: 0.5820. Take Profit 1: 0.5700. Take Profit 2: 0.5650. 🔮 Major Levels: 0.5900 (Resistance – Major Supply) 0.5850 (Resistance – Recent Swing High) 0.5759 (Current Active Price) 0.5700 (Support – Options Barrier) 0.5650 (Target – Historical Wick Low) 0.5600 (Target – Macro Abyss) https://www.youtube.com/watch?v=hyGu9b2ZKmU&pp=ygUMbnpkL3VzZCB0aXBz The Great Convergence: A 2026 EUR/USD Deep-Dive into the Era of the “Euro-Resurgence” 🌍 While the world was busy watching the US Dollar’s decade of dominance, the tectonic plates of the global economy quietly shifted. In 2026, the ‘US Exceptionalism’ trade is officially dead. As the Fed settles into a neutral stance and Germany’s historic €500 billion stimulus begins to roar, the EUR/USD is no longer just a currency pair—it is the ultimate scoreboard for a new global financial order. Are you positioned for the 1.2500 breakout, or are you still trading yesterday’s news? Executive Summary: The 2026 Playbook The Macro-Pivot Strategy: 2026 marks the “Great
USD/CAD (US Dollar / Canadian Dollar): “The Loonie” | March 2026 Forecast
USD/CAD: The Petro-Dollar Drag 📅 Mar 26, 2026 Slipping global oil prices are destroying the Canadian Dollar’s fundamental backing. Combined with USD strength, this pair is a runaway freight train. 📊 Today’s Forecast & Analysis: The Signal: LONG (Buy the Pullback) Entry Zone: 1.3820 – 1.3840. Stop Loss: 1.3780. Take Profit 1: 1.3950. Take Profit 2: 1.4000. 🔮 Major Levels: 1.4000 (Resistance – The Ultimate Round Number) 1.3920 (Resistance – Near-term Supply) 1.3851 (Current Active Price) 1.3820 (Support – Recent Breakout Ledge) 1.3750 (Support – Moving Average Floor) 1.3680 (Support – Trend Base) https://www.youtube.com/watch?v=6BhHOo_fhYM&pp=ygUHdXNkL2NhZA%3D%3D The Great Divergence: Why USD/CAD is the “Alpha Trade” of 2026 (A 360° Deep Dive) The “Mortgage Cliff” Decoupling: While the US consumer enjoys 30-year fixed rates, Canada faces a ticking time bomb. 60% of all Canadian mortgages renew in 2025–2026, triggering an average payment shock of +15-20%. This forces the Bank of Canada (BoC) to keep rates historically lower than the Fed, creating a permanent floor for USD/CAD. The USMCA Risk Premium: July 2026 is the “Event Horizon.” The renegotiation of the US-Mexico-Canada Agreement will inject massive volatility. Expect “Buy the Rumor (USD), Sell the Fact” behavior as trade war rhetoric spikes, punishing the export-dependent
AUD/USD (Australian Dollar / US Dollar): “The Aussie” | March 2026 Forecast
AUD/USD: The Commodity Collapse 📅 Mar 26, 2026 The Aussie is being hammered by a dual threat: a stalling Chinese economy dragging down commodities and a relentless US Dollar. 📊 Today’s Forecast & Analysis: The Signal: SHORT (Momentum Continuation) Entry Zone: 0.6900 – 0.6920 (Fade any slight intraday spikes). Stop Loss: 0.6960. Take Profit 1: 0.6850. Take Profit 2: 0.6800. 🔮 Major Levels: 0.7000 (Resistance – Macro Ceiling) 0.6950 (Resistance – Psychological Floor Flipped to Ceiling) 0.6889 (Current Active Price) 0.6850 (Support – Liquidity Pocket) 0.6800 (Target – Deep Structural Support) 0.6750 (Target – Capitulation Zone) The AUD/USD, or “The Aussie,” is the market’s favorite “Risk-On” proxy. It is a commodity currency, heavily correlated with the prices of gold, iron ore, and copper. Because Australia is geographically and economically linked to Asia, the Aussie is often treated by traders as a “liquid proxy” for China’s economic health. When China booms, the Aussie soars; when China slows, the Aussie tanks. It is also a favorite for “Carry Traders” when Australian interest rates are higher than US rates, though this dynamic shifts based on RBA vs. Fed policy. In-Depth Analysis of AUD/USD Forecast for 2026 The AUD/USD exchange rate, influenced by commodity
USD/CHF (US Dollar / Swiss Franc): “The Swissy” | March 2026 Forecast
USD/CHF: The Safe-Haven Squeeze 📅 Mar 26, 2026 The Swiss Franc is losing ground as capital flows back into the US Dollar for yield and safety. The momentum is entirely one-sided. 📊 Today’s Forecast & Analysis: The Signal: LONG (Trend Continuation) Entry Zone: 0.7930 – 0.7950. Stop Loss: 0.7880. Take Profit: 0.8050. 🔮 Major Levels: 0.8100 (Resistance – Macro Target) 0.8050 (Resistance – Psychological Magnet) 0.7950 (Current Active Price) 0.7900 (Support – Local Consolidation) 0.7850 (Support – Moving Average Dynamic Support) 0.7800 (Support – Trend Invalidation) https://www.youtube.com/watch?v=wt4rSmrp8Ow&pp=ygUMdXNkL2NoZiB0aXBz The Zero-Bound Collision: Unlocking the USD/CHF 2026 Alpha Matrix The Definitive Institutional Playbook for the “Floor vs. Ceiling” War The “Floor Defense” Paradox: Entering 2026, the Swiss National Bank (SNB) is cornered. With rates at 0.00% and inflation forecasted at an anemic 0.3%, they have hit the “Zero Lower Bound.” They cannot cut rates further without returning to the hated negative rate regime. Their only tool left is FX intervention—buying foreign assets to weaken the Franc. This creates a concrete “Hard Floor” at 0.7800. We are no longer trading a free float; we are trading against a central bank with a printing press. The “Carry Trade” Decay: The USD’s superpower—the massive interest
GBP/USD (British Pound / US Dollar): “The Cable” | March 2026 Forecast
GBP/USD: The Geopolitical Pivot 📅 Mar 26, 2026 Cable is oscillating wildly on Middle East headlines. Tentative de-escalation rumors are trying to spark a recovery, but the overhead supply is suffocating. 📊 Today’s Forecast & Analysis: The Signal: WAIT (Chop Zone) -> LONG (Breakout Confirmation) Entry Zone: 1.3400 (Do not guess. Wait for a clean 4H close above the immediate consolidation box). Stop Loss: 1.3320. Take Profit 1: 1.3490. Take Profit 2: 1.3550. 🔮 Major Levels: 1.3550 (Resistance – Macro Ceiling) 1.3494 (Resistance – Continuation Target) 1.3434 (Resistance – Top of Current Range) 1.3364 (Current Active Price) 1.3255 (Support – Near-Term Floor) 1.3119 (Support – Breakdown Abyss) https://www.youtube.com/watch?v=LDAahZ_beW4&pp=ygUHZ2JwL3VzZA%3D%3D The Kingmaker’s Protocol: Cracking the Code of GBP/USD in 2026 The easy money is gone. The post-pandemic volatility spikes are history. Welcome to 2026: The year where the “Great Convergence” separates the gamblers from the grandmasters. While the retail crowd chases ghost patterns from 2024, institutional algorithms have shifted the battlefield. This isn’t just a forecast; it is a blueprint for survival in the most sophisticated FX market of the decade. If you want to know where the Smart Money is hiding their orders before the charts are drawn, read on.
Mastering the EUR/USD “Fiber” for 2026 and Beyond | March 2026 Forecast
EUR/USD: The Dollar Wrecking Ball 📅 Mar 26, 2026 Cable is oscillating wildly on Middle East headlines. Tentative de-escalation rumors are trying to spark a recovery, but the overhead supply is suffocating. 📊 Today’s Forecast & Analysis: The Signal: SHORT (Sell the Relief Grind) Entry Zone: 1.1540 – 1.1570 (Short directly into the algorithmic bounce). Stop Loss: 1.1620 (Structural invalidation). Take Profit 1: 1.1475 (The macro capitulation wick). Take Profit 2: 1.1400. 🔮 Major Levels: 1.1650 (Resistance – Previous Floor, Now Ceiling) 1.1570 (Resistance – Algorithmic Supply) 1.1530 (Current Active Price) 1.1475 (Support – The “King” Level / Macro Wick) 1.1400 (Support – Option Barrier) 1.1350 (Target – Institutional Abyss Level) https://www.youtube.com/watch?v=ueFIldPjd4U&pp=ygUHZXVyL3VzZNIHCQlPCgGHKiGM7w%3D%3D Macro conditions are aligning for a structural regime shift. US exceptionalism is fatiguing, the Supreme Court has heavily diluted the broad tariff threat, and a multi-year €500 billion German infrastructure impulse is finally hitting the real economy. The consensus is still trading last year’s dollar dominance, but the smart money is quietly front-running a massive capital reallocation back into Eurozone assets. Trading at 1.178, EUR/USD is coiling for a breakout. This is the exact macroeconomic cocktail—relative policy credibility combined with fiscal asymmetry—that powered the euro from 0.95

USD/JPY (US Dollar / Japanese Yen): “The Ninja” | March 2026 Forecast
💴 USD/JPY Reverts to Yield Differentials Over Haven Flows USD/JPY will test critical resistance thresholds as yield spreads widen in favor of the greenback. The Bank of Japan will face intense pressure to accelerate normalization or risk catastrophic currency devaluation. Carry trades shorting the yen will experience renewed institutional inflows until US inflation data shows structural weakness. The Swiss Franc will demonstrate isolated resilience due to European geographic proximity, but will ultimately bow to US dollar dominance. Retail traders are staring at a 9% monthly rip in WTI, glued to the U.S.-Iran headlines, and screaming “Energy Supercycle.” Institutional commodity desks are looking at the exact same $66.52 price tag, running the EIA supply/demand balances, and preparing the mother of all short trades. We are currently living in a physical market distortion. Geopolitical brinkmanship in the Strait of Hormuz has injected a $4–$6 “fear premium” into the front month, masking a terrifying structural reality: a 2.0 to 3.7 million barrel per day (mb/d) global surplus is barreling down the pipeline in 2026. If you are buying naked long oil futures here, you aren’t an investor; you are a geopolitical gambler. Here is the institutional blueprint for fading the panic and harvesting

US Dollar Surges on Safe-Haven Demand
The DXY spiked dramatically as global conflict pushed investors into the ultimate liquidity harbor. The U.S. Dollar has staged a relentless rebound against major currencies, driven by escalating uncertainty in the Middle East and fears of prolonged disruptions to global shipping lanes. As European and Asian equities faced aggressive sell-offs, institutional capital aggressively rotated into cash. However, the greenback’s momentum is beginning to face headwinds. De-escalation rhetoric from U.S. leadership regarding the Iran conflict has injected a sudden wave of risk appetite back into the market. Traders must now pivot their focus from purely geopolitical hedging back to the Federal Reserve’s upcoming inflation data and interest rate trajectory. The US Dollar Index (DXY) spiked to 98.75 amid the conflict before slightly pulling back as markets digested potential ceasefire signals. The DXY will face heavy resistance at the 99.00 level unless fresh military escalations occur in the Persian Gulf. EUR/USD risks further downside toward the 1.1500 support zone if Eurozone growth continues to lag behind U.S. resilience. Inflation data (CPI and PCE) this week will be the ultimate tiebreaker for the dollar’s near-term directional bias. A sudden de-escalation in the Middle East could trigger a rapid, violent unwinding of

Forecast and Strategic Assessment: Global and Regional Trajectories Following the Decapitation of the Iranian Regime
The geopolitical architecture of the Middle East, and by extension the broader international system, has reached a profound and irreversible inflection point following the unprecedented events of February 28, 2026. The coordinated military campaign, designated “Operation Epic Fury,” executed jointly by the armed forces of the United States and Israel, has fundamentally ruptured the structural equilibrium of the Islamic Republic of Iran.1 The confirmed death of Supreme Leader Ayatollah Ali Khamenei, alongside the systematic decapitation of the Islamic Revolutionary Guard Corps (IRGC) high command and the destruction of critical nuclear and military infrastructure, has precipitated a catastrophic power vacuum within a state already severely compromised by terminal macroeconomic insolvency and unprecedented domestic uprisings.3 The primary analytical question surrounding the post-Khamenei era is no longer whether the structural integrity of the 1979 theocratic model will survive. The data definitively indicates that the Islamic Republic, as previously constituted, has functionally collapsed. The critical inquiry is whether the ensuing transition will trend toward a managed democratic stabilization, or whether the geopolitical vacuum will devolve into a protracted, multipolar civil war characterized by sectarian fragmentation, regional proxy autonomy, and global economic disruption. This comprehensive, data-driven forecast utilizes quantitative conflict models, macroeconomic indicators, real-time military
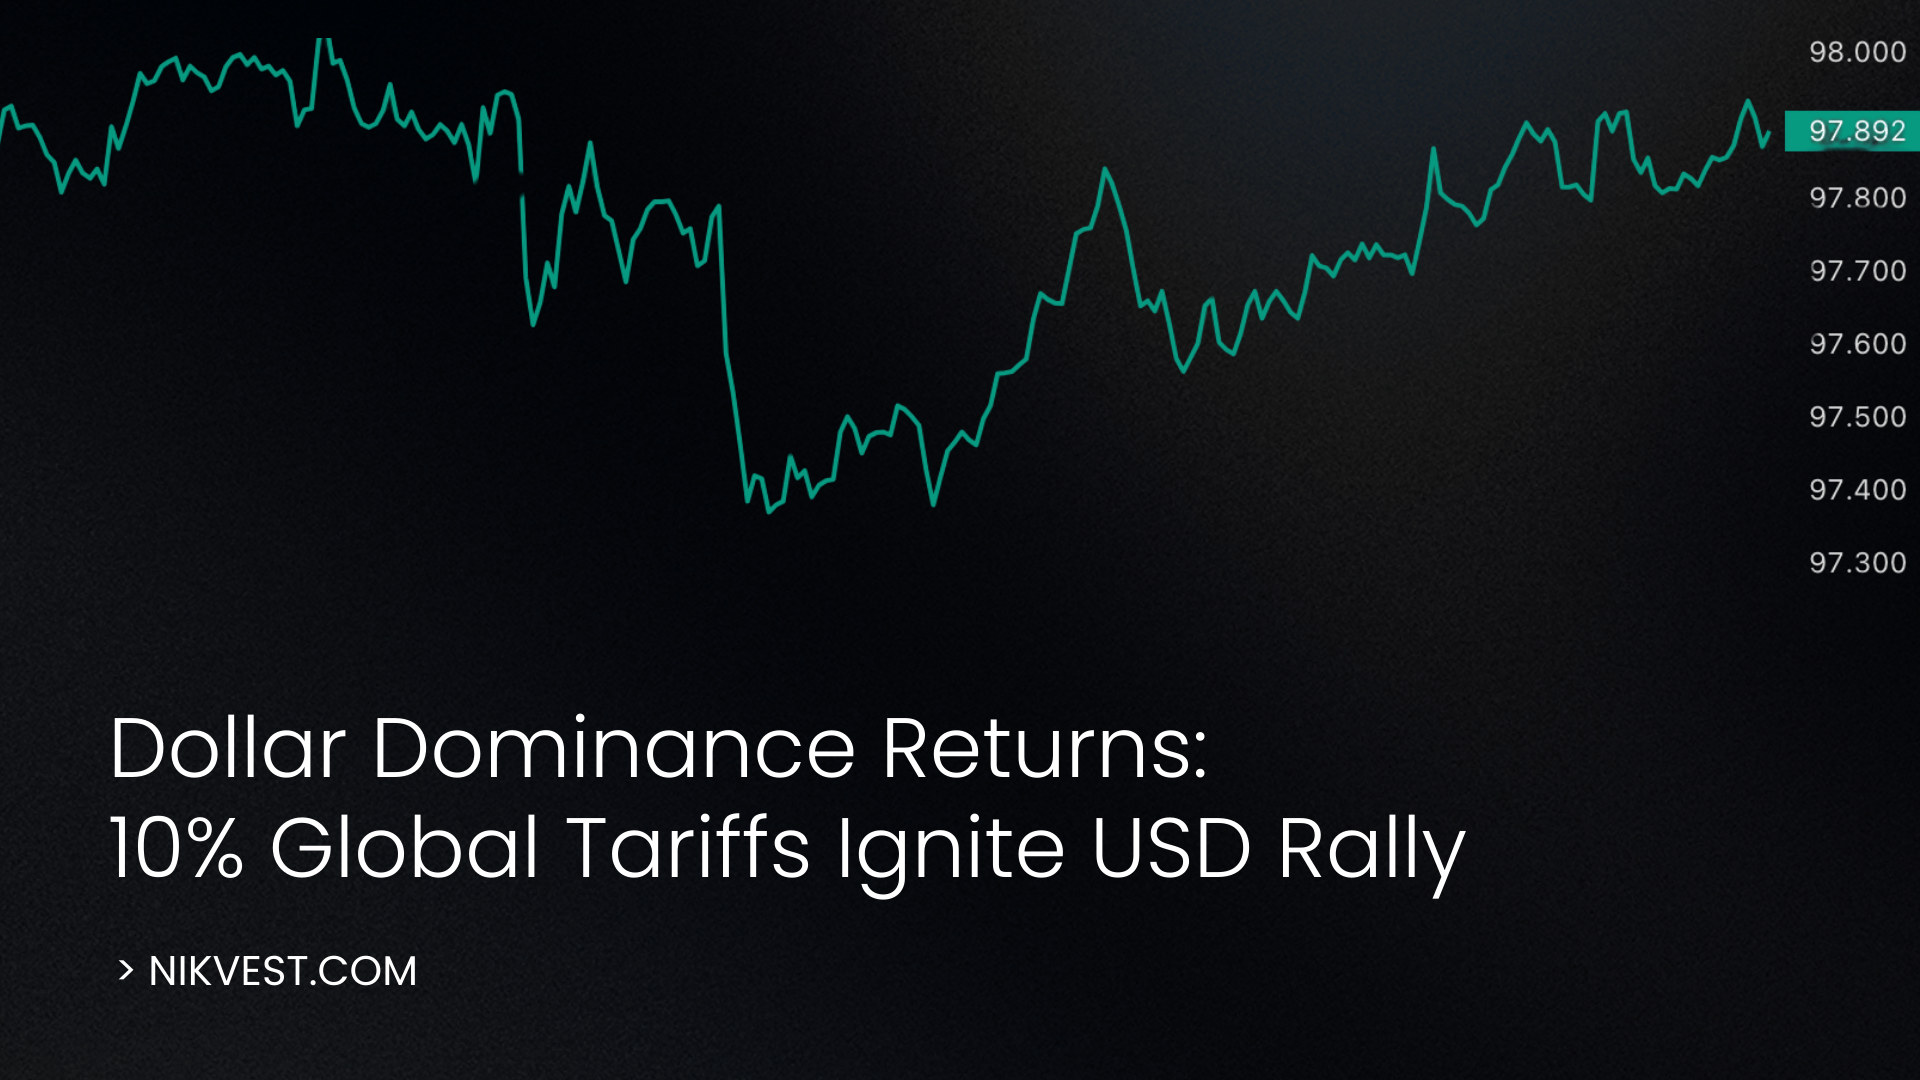
Dollar Dominance Returns: 10% Global Tariffs Ignite USD Rally
The rules of global trade were just rewritten overnight, and the market is scrambling to price in the new reality. With the landmark 10% global US tariff officially live—cleared by the Supreme Court and injected directly into the veins of the global economy—the era of free-flowing, frictionless capital is dead. The US Dollar is morphing from a mere reserve currency into a weaponized financial fortress. As the DXY violently targets 98 and the Euro teeters on the edge of a technical abyss, the question isn’t whether a trade war is coming; it’s how much of it you are prepared to monetize. Are you hedging the retaliation, or are you about to be collateral damage in the new Currency Cold War? 🌍 Executive Summary: The Architecture of the Tariff Shock The 10% Reality and The Exemption Arbitrage: The implementation of a blanket 10% global tariff (adjusted down from the initially feared 15% via SCOTUS narrowing) is a seismic macroeconomic event. This isn’t just a tax on imports; it is a structural repricing of global supply chains. However, the true alpha lies in the “Key Exemptions.” The market is currently indiscriminately selling global exporters, but high-IQ capital is aggressively hunting for the

The 1.176 Pivot: Where Macro Reality Collides with Technical Gravity
The euro is officially backed into a corner. When hawkish Federal Reserve minutes slam into European growth anxieties, the result is a brutal 1.5% slide in EUR/USD right into the structural bedrock of the 2026 yearly open. You aren’t just looking at a chart; you are watching a high-stakes tug-of-war between US yield dominance and European economic fragility. 🦅 The Macro Divergence: Why the USD is Firming The recent FOMC minutes delivered a harsh reality check to dollar bears. With policymakers acknowledging that interest rates could stay restrictive—or even rise if inflation proves sticky—the “imminent easing” narrative has completely evaporated. This rate-differential compression mathematically favors the Greenback. While European data has shown isolated pockets of resilience, the overarching growth concerns leave the European Central Bank (ECB) in a vulnerable position. Until the ECB explicitly signals deeper cuts or US economic data materially collapses, the path of least resistance for global capital is flowing across the Atlantic and into US-denominated assets. 📉 The Technical Battleground The 1.176–1.178 zone is not an arbitrary support band; it is a critical Fibonacci retracement level and the absolute line in the sand for Euro bulls. The Bear Case (Breakdown): A sustained daily close below 1.176

Global Macro: The “Peace Shock” & The Golden Hedge
1. Crude Oil (WTI): The Geneva Peace Talks Crash Peace is profitable for humanity, but catastrophic for oil bulls. WTI Crude has plummeted to $58.00 per barrel, touching 12-month lows. The catalyst is the high-stakes diplomatic breakthrough in Geneva between Russia and Ukraine, brokered by US officials. Markets are aggressively pricing in the lifting of sanctions on Russian oil, which would flood an already oversupplied market with millions of barrels. While Secretary of State Marco Rubio calls the talks “productive,” energy traders are panicking over the potential supply glut in 2026. This is the “Peace Shock”—a rapid repricing of geopolitical risk that is catching hedge funds off guard. 2. Gold (XAU/USD): The $4,000 Fortress When currencies wobble, the world runs to the yellow metal. Gold is trading at $4,042.59/oz, defying the “risk-on” sentiment usually associated with peace talks. Why? The Fed is divided. With the US unemployment rate ticking up to 4.4%, the market is pricing in a 70% chance of a December rate cut. Investors are treating Gold not just as an inflation hedge, but as insurance against policy error. Central banks (notably China and Poland) continue to buy the dip, creating a hard floor at $4,000.

The Energy Stagflation Bleed: EUR/USD April Forecast
Europe is choking on $112 crude oil. The US Dollar is the only game in town as stagflation fears grip the Eurozone. Signal: SHORT (Sell the Relief Grind) 6 Major Levels: 1.1650 (Resistance – Flipped Ceiling) 1.1598 (Resistance – Algorithmic Supply) 1.1520 (Current Active Price) 1.1475 (Support – The “King” Level / Capitulation Wick) 1.1400 (Support – Options Barrier) 1.1350 (Target – Institutional Abyss Level) April Price Prediction and Forecast: The European Central Bank is entirely trapped. They are facing severe energy-driven inflation spikes just as their industrial core begins to contract. They cannot hike rates without collapsing their economy, yet holding rates steady destroys the Euro against a hawkish Federal Reserve. Every minor rally on the EUR/USD chart is simply algorithmic short-covering. Probabilities: 70% probability of a continued breakdown as energy prices remain elevated; 30% chance of choppy stabilization if Middle East tensions unexpectedly de-escalate. April Prediction: Gravity takes hold. The pair will likely slice through the 1.1475 macro wick and settle near the 1.1400 options barrier.
Mastering the EUR/USD “Fiber” for 2026 and Beyond | March 2026 Forecast
EUR/USD: The Dollar Wrecking Ball 📅 Mar 26, 2026 Cable is oscillating wildly on Middle East headlines. Tentative de-escalation rumors are trying to spark a recovery, but the overhead supply is suffocating. 📊 Today’s Forecast & Analysis: The Signal: SHORT (Sell the Relief Grind) Entry Zone: 1.1540 – 1.1570 (Short directly into the algorithmic bounce). Stop Loss: 1.1620 (Structural invalidation). Take Profit 1: 1.1475 (The macro capitulation wick). Take Profit 2: 1.1400. 🔮 Major Levels: 1.1650 (Resistance – Previous Floor, Now Ceiling) 1.1570 (Resistance – Algorithmic Supply) 1.1530 (Current Active Price) 1.1475 (Support – The “King” Level / Macro Wick) 1.1400 (Support – Option Barrier) 1.1350 (Target – Institutional Abyss Level) https://www.youtube.com/watch?v=ueFIldPjd4U&pp=ygUHZXVyL3VzZNIHCQlPCgGHKiGM7w%3D%3D Macro conditions are aligning for a structural regime shift. US exceptionalism is fatiguing, the Supreme Court has heavily diluted the broad tariff threat, and a multi-year €500 billion German infrastructure impulse is finally hitting the real economy. The consensus is still trading last year’s dollar dominance, but the smart money is quietly front-running a massive capital reallocation back into Eurozone assets. Trading at 1.178, EUR/USD is coiling for a breakout. This is the exact macroeconomic cocktail—relative policy credibility combined with fiscal asymmetry—that powered the euro from 0.95 to 1.60 between 2002 and 2008. The sequel is playing out right now. Here is the institutional blueprint for navigating the EUR/USD trajectory through 2026. 🦅 The Core Thesis: “Hawkish Neutral” vs. US Fatigue The 2026 trajectory is defined by three fundamental pillars driving the pair toward a year-end target of 1.225: Real-Yield Compression: The 2-year real yield spread between the US and the Eurozone currently sits at ~175bps. Institutional consensus sees this narrowing to ~125bps by December. Regression models from the last decade dictate that every 25bps of compression historically adds ~0.8% to 1.1% to EUR/USD. The ECB’s Dovish
US Dollar Surges on Safe-Haven Demand
The DXY spiked dramatically as global conflict pushed investors into the ultimate liquidity harbor. The U.S. Dollar has staged a relentless rebound against major currencies, driven by escalating uncertainty in the Middle East and fears of prolonged disruptions to global shipping lanes. As European and Asian equities faced aggressive sell-offs, institutional capital aggressively rotated into cash. However, the greenback’s momentum is beginning to face headwinds. De-escalation rhetoric from U.S. leadership regarding the Iran conflict has injected a sudden wave of risk appetite back into the market. Traders must now pivot their focus from purely geopolitical hedging back to the Federal Reserve’s upcoming inflation data and interest rate trajectory. The US Dollar Index (DXY) spiked to 98.75 amid the conflict before slightly pulling back as markets digested potential ceasefire signals. The DXY will face heavy resistance at the 99.00 level unless fresh military escalations occur in the Persian Gulf. EUR/USD risks further downside toward the 1.1500 support zone if Eurozone growth continues to lag behind U.S. resilience. Inflation data (CPI and PCE) this week will be the ultimate tiebreaker for the dollar’s near-term directional bias. A sudden de-escalation in the Middle East could trigger a rapid, violent unwinding of long-dollar positions.
Dollar Dominance Returns: 10% Global Tariffs Ignite USD Rally
The rules of global trade were just rewritten overnight, and the market is scrambling to price in the new reality. With the landmark 10% global US tariff officially live—cleared by the Supreme Court and injected directly into the veins of the global economy—the era of free-flowing, frictionless capital is dead. The US Dollar is morphing from a mere reserve currency into a weaponized financial fortress. As the DXY violently targets 98 and the Euro teeters on the edge of a technical abyss, the question isn’t whether a trade war is coming; it’s how much of it you are prepared to monetize. Are you hedging the retaliation, or are you about to be collateral damage in the new Currency Cold War? 🌍 Executive Summary: The Architecture of the Tariff Shock The 10% Reality and The Exemption Arbitrage: The implementation of a blanket 10% global tariff (adjusted down from the initially feared 15% via SCOTUS narrowing) is a seismic macroeconomic event. This isn’t just a tax on imports; it is a structural repricing of global supply chains. However, the true alpha lies in the “Key Exemptions.” The market is currently indiscriminately selling global exporters, but high-IQ capital is aggressively hunting for the specific sectors and nations granted pardons. Understanding the legal nuances of these post-SCOTUS adjustments allows you to buy artificially suppressed assets that are immune to the new border tax. The Dollar Vacuum (DXY to 98): The US Dollar is reclaiming its throne, pushing aggressively toward the 98 level. This is driven by a dual-engine catalyst: the mechanical reality of higher domestic inflation (which keeps the Federal Reserve hawkish) and the psychological reality of safe-haven flows. When global trade uncertainty spikes, institutional capital repatriates to the deepest, most liquid market on earth. The “Fortress Dollar” is actively sucking liquidity out of
The 1.176 Pivot: Where Macro Reality Collides with Technical Gravity
The euro is officially backed into a corner. When hawkish Federal Reserve minutes slam into European growth anxieties, the result is a brutal 1.5% slide in EUR/USD right into the structural bedrock of the 2026 yearly open. You aren’t just looking at a chart; you are watching a high-stakes tug-of-war between US yield dominance and European economic fragility. 🦅 The Macro Divergence: Why the USD is Firming The recent FOMC minutes delivered a harsh reality check to dollar bears. With policymakers acknowledging that interest rates could stay restrictive—or even rise if inflation proves sticky—the “imminent easing” narrative has completely evaporated. This rate-differential compression mathematically favors the Greenback. While European data has shown isolated pockets of resilience, the overarching growth concerns leave the European Central Bank (ECB) in a vulnerable position. Until the ECB explicitly signals deeper cuts or US economic data materially collapses, the path of least resistance for global capital is flowing across the Atlantic and into US-denominated assets. 📉 The Technical Battleground The 1.176–1.178 zone is not an arbitrary support band; it is a critical Fibonacci retracement level and the absolute line in the sand for Euro bulls. The Bear Case (Breakdown): A sustained daily close below 1.176 invalidates the recent bullish structure. It opens the trapdoor toward the 1.1580 level, with the 1.1500 psychological zone becoming the ultimate downside magnet as stop-losses trigger. The Bull Case (Defense): If institutional buyers step in to defend the yearly open, the broader consolidation range remains intact. This keeps the medium-term objective of 1.22–1.25 alive, though realizing that target relies heavily on the Fed finally pivoting later in 2026. 📊 The Flash PMI Catalyst Technical levels provide the framework, but macroeconomic data is the hammer. The upcoming release of the German and Eurozone flash PMIs will act as the immediate directional

Forex & Commodities: USD Strength and Geopolitical Twists Redefine the Landscape
The world of currencies and raw materials feels like a high-stakes game these days, with the dollar’s comeback throwing shade on everything from gold to oil. As U.S. economic data looms and tensions in Ukraine ripple through supply lines, everyone’s adjusting their strategies for what could be a wild ride ahead. Here’s a look at the four biggest movers today. Gold Stays on the Defensive: USD Uptick Keeps the Pressure On Spark Your Strategy: Seen a classic safe-haven like gold get pushed around by a resurgent dollar? This pullback might just be the moment to rethink your positions—or jump in if the tide turns. Gold prices are holding back today, dipping amid a slight dollar rebound as markets weigh the odds of a Fed rate cut in December, now sitting at around 60.2% per the CME FedWatch tool. Spot gold is hovering near $4,081.84 an ounce, down from recent highs as reduced expectations for aggressive easing bolster the greenback. The DXY index is up to about 99.4, adding weight. Geopolitical worries from Ukraine offer some underpin, but all eyes are on delayed U.S. data like retail sales that could lock in a “wait-and-see” Fed stance. Outlook: Support around $4,023 could hold firm, with potential upside to $4,210 if inflation data softens hawkish views. Long-term, central bank purchases keep the bull case alive in this ongoing trend. EUR/USD Teeters Near 1.1600: Bears Eye a Deeper Slide Unlock Your Next Move: Wondering if the euro’s momentum is finally cracking under dollar pressure? Catch this potential breakdown and surf the wave for some serious forex gains. EUR/USD is extending its slide for another day, teasing the 1.1600 level as fading Fed cut bets lift the USD across the board. Trading around 1.16113, the pair finds support at 1.1570-1.1575, but a break could